 Many climate activists are extremely pessimistic about the impacts of climate change. On the other end, most climate skeptics believe that climate change is not a serious problem. These beliefs are based on several entrenched misconceptions. Here, we will review the common misconceptions of climate skeptics.
Before moving ahead, it is important to clarify the use of the term “serious problem”. For this article, a serious problem is one that can have a major impact on the well-being of the global society. Currently, billions lack access to safe water and clean cooking fuels. There is low trust in governments. Global debts are surging. These are all examples of serious problems by my definition. Four key misconceptions of skeptics about human caused climate change are discussed in this article. Please note that “human caused climate change” is referred to as “climate change” for brevity hereafter. Misconception #1: Climate science is not settled. So, there is no need to worry about it.Skeptics believe that climate change cannot be viewed as a serious problem because there are many uncertainties associated with climate science. As discussed below, this is a flawed argument. Our climate is a very complex system. It consists of five components: atmosphere, biosphere, cryosphere, hydrosphere, and land surface. These components interact with each other in a convoluted manner. Uncertainties in climate science are expected because of the unusual complexity. The uncertainties will never be eliminated. But scientific efforts can decrease them by improving our understanding about the climate system. Tens of thousands of scientists have studied the climate system to better understand it. Climate science has been one of the most intensive areas of research in recent decades. Scientists have had access to an array of weather and climate monitoring tools for several decades. These tools have been used to collect a vast amount of data. The data has provided valuable information about the past and the present climate. This information has been used to develop and validate scientific theories. Decades of such efforts have improved the understanding of climate change. Because of these efforts, there is high certainty about several aspects of climate change and its impacts. We will review below some of the key aspects of our climate that are understood with high confidence and have global relevance. The information is from the latest report by the United Nations body on climate change (IPCC). · The increases in CO2 and methane concentrations since 1750 are much higher than any natural changes over at least the past eight hundred thousand years. · Human influence has warmed the atmosphere, ocean, and land. The global temperature has increased faster since 1970 than in any fifty-year period over at least the last two thousand years. · Extreme events such as heat waves have become more frequent and intense across most land regions since the 1950s. Humans are responsible for these events. · Humans are contributing to the global retreat of glaciers, decrease in artic sea ice and Greenland ice sheets. · The global mean sea level has risen faster since 1900 than over any prior century in at least the last three thousand years. Humans are responsible for the rise. · Humans are responsible for the acidification of oceans. · The changes are negatively impacting our terrestrial and ocean ecosystems. This is critical because we are strongly connected to our ecosystems. · Over three billion people live in regions that are highly exposed to climate change. A high proportion of other species are also exposed to climate change. · Greenhouse gas emissions cause several changes that are not reversed over hundreds or even thousands of years. Examples of such changes include those in the oceans, ice sheets and sea levels. · The impact associated with climate change is expected to increase significantly with every increment increase in global warming. The scientific community has high confidence in the aspects discussed above because a large amount of quality data was available. However, such data is not yet available for all the climate impacts. Because of the lack of adequate data, several of the climate impacts are currently understood at low or moderate confidence levels. As more data becomes available, more of these impacts will be understood with high confidence. One notable fact is key to this discussion. The impacts that are known with high confidence are adequate to show that climate change is a serious problem. Some aspects of climate science will never be completely understood. This is because of the ultra-complex nature of the topic. But several aspects of the climate are well understood, i.e., scientists have a high confidence in these. Basic physics, the extensive data sets, error analysis, and climate models are all consistent with the conclusion that human activities are the cause. The established knowledge is adequate to show that climate change is a serious problem. It is misleading to use the excuse that climate science is not settled to delay efforts to mitigate climate change. Misconception #2: There is no consensus about climate change.Skeptics believe that there is no consensus amongst the global scientists. As discussed below, this belief is not justified. What is consensus? In practical terms, it is a broad agreement or an agreement between a large majority. So, scientific consensus means that a large majority of the scientists agree. We will first consider the view amongst climate scientists. The goal of climate scientists is to understand critical issues about climate science. Climate scientists publish their research findings in scientific journals. We can understand their views through their research papers. Studies have looked at thousands of relevant research papers to understand the views amongst the climate scientists. Relevant research papers are those that discuss what has caused the climate to change. These studies found that only a small fraction of the papers was skeptical about climate change. Their analyses have revealed a broad agreement about climate change amongst climate scientists. Such analyses have a high level of transparency. Any person can redo these analyses using a free resource such as Google Scholar. What about consensus in the rest of the scientific community? The scientific community consists of several millionscientists who are located across the globe. Most scientists belong to one or more scientific organizations. We can understand their views via the statements of the organizations they belong to. The scientific organizations around the globe openly support that climate change is a serious problem. This includes virtually every national academy and major scientific organization. Such open and strong support from the organizations is possible because there is general agreement amongst its members about climate change. The support or consensus amongst the general scientific community is not surprising. It is a logical response. It acknowledges the efforts of climate scientists over the past several decades. The climate scientists have documented their efforts in tens of thousands of scientific papers. These papers have provided firm evidence of climate change. It would be illogical and unethical for scientists from other fields to ignore these findings. Some skeptics use the past claims by certain scientists to challenge the conclusions about climate change. Certain scientists have made wild predictions that were completely wrong. For example, the famous physicist John Holdren proposed in the 1980s that the famines caused by climate change could kill a billion people by 2020. It is not logical to use such predictions to challenge climate science. The wild predictions were based on speculations. They were subjective and not supported by scientific facts. The global scientific community did not support such predictions. The situation is distinctly different for climate change. The main conclusions about climate change are based on scientific principles and a gigantic number of observations. That is why the global scientists accept these conclusions. Let us consider an illustrative example. Extensive research has shown that obesity can lead to major diseases. Medical science and observations support this conclusion. Therefore, the medical community all over the world accepts the conclusion. Wild claims in the past, present, or future cannot challenge the validity of the strong connection between obesity and long-term health. Climate science is a very complex field. So, we expect that a few scientists will have different views about climate change. But there is no smoking gun argument presented by this minority. Specifically, the minority has not provided the needed evidence to counter the collective conclusions which are based on the work of a large majority of the climate experts. There is no reason to believe the minority and reject the large majority. Consider the case where a person with brain tumor consults with ten cancer specialists. Nine of these believe that an immediate surgery would provide the best outcome. One specialist believes that chemotherapy alone would provide the best outcome. Statistically, this decision is straight forward. It would make most sense to proceed with an immediate surgery. There is a possibility that the one specialist is right. But that possibility is statistically much lower. Common sense would be to proceed with the alternative that is statistically far more probable. This logic extends to any serious problem. Climate scientists agree that climate change is a serious problem. This conclusion from the super majority is statistically far more likely to be correct. It is common sense to accept the collective recommendation about climate change from the super majority of climate experts. An important note: The consensus amongst the global scientists is that climate change is a serious problem. The consensus does not extend to the end-of-the-world views presented by many climate activists. Misconception #3: Climate has always been changing. It is no different this time. Indeed, the climate has been changing since the beginning of time. But there are two major differences between the past and the current change in climates. · First, humans are driving the current change in climate. So, we can mitigate its impact. In contrast, the past changes were driven by natural causes. · Second, the nature of the recent change is unusual compared to the past. For example, the speed of the recent warming is markedly faster. The speed of past and present changes in temperature has been very different. Earth’s temperature has swung between cool periods and relatively warm periods many times over the past two million years. During the shift from the last cool period to the current warm period, the temperature increased by 5oC over 5000 years. For comparison, earth’s temperature has warmed by 1.1oC over just the last 150 years. Robust data is available which shows that the speed of global warming in the last 50 years has been more than any other 50-year period in the last 2000 years. Let us look at two more examples which show the unusual speed of the impact. · Recent acidification of the oceans is far faster than during the past several million years. Sea levels have also been rising faster. The rise in sea levels since the year 1900 has been faster than any other century in the past 3000 years. · Frequency and intensity of extreme events such as heat waves have been increasing at a fast pace in the recent decades. For example, the frequency of heat waves per year in the United States has increased by a factor of three since the 1960s. Heat waves are of concern because of their impact on health, agriculture, and energy production. Slower rates of change, like in the past, allowed for a long time for the species to adapt to the changing climate. The enormously faster speed of the recent change is a significant concern. Climate experts agree that the impact of climate change is going to worsen significantly with time. This is consistent with the trends observed over the past decades and the output from climate models. The more we wait, the worse will be the impact. So, urgent action is necessary. The term urgent action can have a different meaning for different people. I will take a moment to share my definition. Urgent action is not a rapid embrace of inefficient solutions. Instead, urgent action involves a well thought out approach that will enable the fastest possible transition. Misconception #4: We can manage the impacts of climate change. So, there is no need to decrease greenhouse gas emissions.Skeptics use two principal arguments to support this belief. The first argument uses the decrease in deaths from climate disasters as evidence to suggest that we can manage the impacts. The global deaths related to climate disasters have decreased markedly over the last decades. The deaths have fallen by a factor of three from the decade of 1970s to the 2010s. During this time, the average global temperature has increased by 0.9oC. The deaths have decreased despite the fourfold increase in the number of climate disasters over that period. But the deaths have mainly fallen because of an increase in the use of early warning systems. The warnings have enabled evacuations in a timely manner and have prevented many deaths. But the number of deaths is not the only measure of the impact of the climate disasters. The number of people affected, and the economic losses have increased over the decades. The climate disasters have caused significant disruptions in many lives and significant economic losses. For example, the climate disasters affected 1.7 billion people and caused damage of $1.4 trillion over the last decade. Climate experts agree that the frequency and intensity of climate disasters will increase markedly with an increase in warming. This will further increase the number of people impacted, and economic damages. The impact of climate disasters is already substantial and is expected to worsen markedly with time. Higher the temperature rise, higher will be the impact on lives and our ecosystem. It is misleading to argue that the decrease in deaths from climate disasters is evidence of our ability to manage the long-term impacts of climate change. The second argument uses climate adaptation as an excuse. Climate adaptation involves the anticipation of the adverse effects of climate change and taking action to minimize damage. Climate adaptation is a crucial part of the solution. It can drastically decrease the life, property, and livelihood loss caused by climate change. But it is not a standalone solution for addressing climate change. There is scientific consensus that the impacts of climate change will increase rapidly if we do not take efforts to mitigate it. If we only focus on adaptation, we will always play catch up. The more we delay our efforts to mitigate climate change, the more we will have to adapt. This will greatly increase the technical and financial challenges for a good outcome. The impacts of climate change are varied and affect every aspect of our ecosystems. Also, the risk of very high impact, low probability events increase with increasing warming. Climate adaptation by itself will fall short because of technical and financial limitations. This will cause a severe impact on the global society and every aspect of our ecosystem. A robust path forward must include urgent efforts to mitigate climate change along with adaptation. Final RemarksThe global temperature has increased by over 1.1oC since the industrial revolution. The greenhouse gas emissions from human activities have caused this distinct rise in temperature. The atmospheric content of greenhouse gases has increased markedly. The increase has been directly linked to human activities such as the use of fossil fuels. The impact of natural causes has been separated from human causes. Basic physics, the extensive data sets, error analysis, and climate models are all consistent with the conclusion that human activities are the cause. Climate change is having a substantial impact around the globe. Several impacts are understood with high confidence. Glaciers, sea ice and ice sheets are decreasing and sea levels are rising. Plants are growing faster. Oceans are being acidified. Severe events such as hot extremes are increasing. Cold extremes are decreasing. Overall, climate change is having a significant negative impact on the global ecosystem. The trends in the data, the improved understanding of climate science and the climate models have clarified the future impacts. The impact is expected to become more and more severe as the temperature rises. Climate change will affect a large fraction of the global population over the next decades. It will have a significant impact on life, property and the ecosystems. The level of impact will depend on the rise in temperature. A higher rise in temperature will also increase the potential for low probability but very high impact events. The implications are clear. Climate change needs our urgent attention. Strategies to moderate the impacts via climate adaptation alone will not be enough. The more we delay the efforts to reduce our greenhouse gas emissions, the more we will have to adapt. Unwarranted delays will markedly increase the challenges for a good outcome. Both adaptation and a drastic reduction in greenhouse gas emissions will be necessary to lower the short and long-term impact from climate change. One important note about policies that target climate mitigation. Policies that encourage inefficient solutions will cause major delays. So, it is crucial that the policies are consistent with the science and practical aspects of both climate and energy. Note: This is a modified excerpt from my book “The Climate Misinformation Crisis: How to move past the mistruths to a smarter energy future. “
0 Comments
 Electric cars are a topic of significant interest because of their role in the low carbon energy transition. In this article, I will discuss the current impact of electric cars on global fuel and electricity use and greenhouse gas emission reductions. I will also discuss the maximum possible impact of electric vehicles on global greenhouse gas emissions.
Note: The term “cars” refers to the light duty vehicles category which include cars of all sizes, sport utility vehicles, crossovers, light trucks, and minivans. Here, electric cars include battery electric cars and plug-in hybrids. Electric cars sales and global shareThe sales of electric cars have markedly increased in recent years, driven by the large subsidies from the global governments. The global subsidies in the year 2022 alone (through direct purchase incentives) were 40 billion dollars¹. The International Energy Agency (IEA) frequently provides an update on the sales²𝄒³. The sales of electric cars have increased from less than 1 million cars in 2017 to 10 million in 2022. IEA estimates the sales of the electric cars to be 14 million in 2023. The current share of electric cars in the global car fleet is roughly 3%⁴. More than half of the electric cars on the road are currently in China⁵. Current impact of electric carsIEA reported that the fleet of electric cars reduced the use of global oil by 0.5 million barrels per day in 2022⁶. For reference, the current global oil use is 100 million barrels per day⁷. What about the impact on electricity use? IEA reports that the global electric car fleet consumed 70 TWh of electricity in 2022. What does this mean in terms of greenhouse gas reduction? In 2022, the global fleet of electric cars reduced the greenhouse gas emissions by 68 million tons because of the avoided oil use⁸. On the other hand, the global fleet increased the emissions by 35 million tons because of the additional use of electricity⁹. On a net basis, the global fleet of electric vehicles reduced the global greenhouse gas emissions by 33 million tons¹⁰. The annual global greenhouse gas emissions were roughly 54 billion tons in 2022¹¹. So, the global fleet of electric cars decreased the greenhouse gas emissions by less than 0.1% in 2022. If we include the fleet of electric cars that are estimated to be added in 2023, the percent reduction will increase to 0.1%¹². How much is 0.1% reduction in greenhouse gas emissions? We can achieve the same reduction by replacing 0.4% of the global coal power with low carbon power¹³. Maximum (potential) impact of electric carsThe transportation sector contributes to 16% of the greenhouse gas emissions¹⁴𝄒¹⁵. Cars are a part of this sector. The cars subsector contributes to roughly 7% of the emissions¹⁶. This informs us that electric cars at a maximum can reduce the global greenhouse gas emissions by 7%. This maximum is only possible if the conventional cars are replaced by electric cars that all use low carbon electricity. That is not the case today. Most countries do not use low carbon electricity¹⁷. Some countries such as Norway and France do. But countries such as China and India use high carbon electricity. Others such as the United States and Germany are in the middle. According to IEA, electric cars emit 50% fewer greenhouse gases compared to conventional cars when considering the global average carbon intensity¹⁸𝄒¹⁹. This means that electric cars can reduce greenhouse gas emissions by 50% from the global cars sector. We can use the above information to estimate the total emission reduction for an overnight switch to 100% electric cars. The global greenhouse gas emissions would reduce by 3.5% if we could magically manage an overnight switch today²⁰. Final RemarksThe current fleet of electric cars has a low impact on greenhouse gas emissions. The impact will grow as the share of electric cars increase and the global grids achieve low carbon intensity. Other options are also available to reduce greenhouse gas emissions from the cars sector. Examples are hybrid cars (intermediate term option) and a major expansion of mass transit. I will compare and contrast these options in a later article. Note: This is a modified excerpt from my book “The Climate Misinformation Crisis: How to move past the mistruths to a smarter energy future. References & Notes[1] IEA Global EV Outlook (2023). Investment. https://www.iea.org/reports/electric-vehicles Subsidies for electric cars in the year 2022 alone were roughly $40 billion. These subsidies only include direct purchase incentives. About 10 million cars were sold in 2022. So, average direct purchase subsidy per electric car sold was $4000. The subsidies represented 10% of the total spending. In the prior years from 2017 to 2022, the subsidies were 20% of the total spending. [2] IEA Electric Vehicles (2023). Overview. https://www.iea.org/reports/electric-vehicles [3] IEA Global EV outlook 2023. Trends in electric light-duty vehicles. https://www.iea.org/reports/global-ev-outlook-2023/trends-in-electric-light-duty-vehicles [4] International organization of motor vehicle operators. Vehicles in use. https://www.oica.net/category/vehicles-in-use/ There were about 1.2 billion cars in use in 2020. Using a historical 4% increase in vehicles per year, the total number of global cars in use is estimated to be 1.3 billion in 2022. The number of electric cars in use in 2022 were 26 million. The number of electric cars in use is estimated to be (26 +14) 40 million in 2023. [5] IEA Global EV outlook 2023. Trends in electric light-duty vehicles. https://www.iea.org/reports/global-ev-outlook-2023/trends-in-electric-light-duty-vehicles [6] IEA Electric Vehicles (2023). Tracking Report. Energy subsection. Electric vehicles avoid oil consumption. https://www.iea.org/reports/electric-vehicles [7] U.S. EIA (2023). Global Oil markets. https://www.eia.gov/outlooks/steo/report/global_oil.php [8] 1 gallon gasoline releases 8887 grams of greenhouse gases (GHG). https://www.epa.gov/greenvehicles/greenhouse-gas-emissions-typical-passenger-vehicle. [9] The average carbon intensity of electrical grid was 494 grams of GHG (CO2 equivalent) per kWh in 2022. https://ember-climate.org/data/data-tools/data-explorer/ This was used to estimate the GHG produced from the 70 TWh electricity consumed by the electric cars. [10] This does not include the electricity consumed during vehicle manufacturing. Electric cars emit more GHGs in their manufacturing process compared to conventional cars. So, the total net GHG reduction by electric cars will be lower than that discussed in the text. [11] EDGAR: GHG emissions of all world countries. https://edgar.jrc.ec.europa.eu/report_2023 [12] According to IEA (https://www.iea.org/reports/electric-vehicles) the electric car sales in 2023 are estimated to be 14 million. This would increase the global fleet of electric cars from 26 million to 40 million. This number can be used to estimate the net GHG reduction for the year 2023 based on data from the previous year. [13] Relative to coal power, low carbon power emits 95% lower GHG emissions per kWh of electricity generated. The global coal power plants emit 10.5 billion tons of GHG per year. https://www.iea.org/reports/global-energy-review-CO2-emissions-in-2021-2. This means that replacing 0.4% coal power with low carbon power will reduce GHG emisions by 40 (10500*0.004*0.95) million tons per year. From the text, the impact of electric vehicles is a net yearly reduction of 37 million tons. [14] Climate Watch: Historical GHG emissions. https://www.climatewatchdata.org/ghg-emissions?breakBy=regions&end_year=2018&gases=ch4®ions=WORLD%2CWORLD§ors=electricity-heat&start_year=1990 [15] World Resources Institute: Sector by sector. Where do global greenhouse gas emissions come from? https://ourworldindata.org/ghg-emissions-by-sector [16] IEA. Global CO2 emission from Transport by sub-sector: 2000 to 2030. https://www.iea.org/data-and-statistics/charts/global-CO2-emissions-from-transport-by-subsector-2000-2030 [17] EMBER-climate Electricity data. World average is 494 gCO2/kWh. https://ember-climate.org/data/data-tools/data-explorer/ For reference, the carbon intensity of a low carbon power grid is less than 100 gCO2 per kWh. [18] IEA: Comparative life cycle GHG emissions from a midsize BEV and ICE vehicle. https://www.iea.org/data-and-statistics/charts/comparative-life-cycle-greenhouse-gas-emissions-of-a-mid-size-bev-and-ice-vehicle Electric cars emit 50% fewer greenhouse gases compared to conventional cars when considering global average carbon intensity. More than half of the cars on the road are in China. The average carbon intensity of the grid in China is 438 gCO2/kWh [19] The 50% reduction is too optimistic based on recent studies. Prior studies used the average carbon intensity of the grid. Of more relevance is the carbon intensity of the marginal electricity being used by electric cars. The marginal electricity is typically provided by coal power or natural gas. So, the carbon intensity of the marginal electricity is higher. This translates to a much lower benefit from electric cars. https://www.pnas.org/doi/abs/10.1073/pnas.2116632119 [20] The global fleet of conventional cars contributes to 7% of the total greenhouse gases. Replacing all conventional cars with electric cars that do not emit any greenhouse gases will reduce the global greenhouse gases by 7%. Replacing conventional cars with electric cars that emit 50% less greenhouse gases will reduce greenhouse gases by 3.5% very year. Countries will continue to lower the emissions from electricity. What if we consider the emissions over the life of the vehicle? It will not make a notable difference. This is because the decrease in the carbon intensity of electricity will be gradual. Also, the 50% reduction is too optimistic based on recent findings. Prior studies including the IEA study used the average carbon intensity of the grid for the estimations. The carbon intensity of the marginal electricity being used by electric cars is more relevant. The marginal electricity is typically provided by coal or natural gas. So, the carbon intensity of the marginal electricity is significantly higher. This translates to a lower benefit from electric cars. https://www.pnas.org/doi/abs/10.1073/pnas.2116632119  When an issue is top priority, there is a willingness to urgently address the issue. This attribute serves as a reality check when we consider the surveys (polls) about the priorities of the global population.
Here, I will review the major surveys from the last decade that inform us about the priorities of the global population . I will also review the critical data about what is driving the priorities. Global Surveys by the United NationsThe United Nations reported the results from a major survey on this topic in December 2014¹. It was the United Nations largest and most inclusive global survey. More than seven million people across the globe took part. The survey asked a simple yet very effective question. The question was: “what matters most to you?”². The participants had to choose six issues that were most important to them amongst a list of sixteen issues. Examples of issues were education, political freedom, equality between men and women, and climate change. The survey identified “a good education”, “better healthcare”, and “better job opportunities” as the three most important issues. The issue “actions taken on climate change” received the least votes. Fifteen other issues were ranked as more important than the actions taken on climate change in the survey. The United Nations was involved in another large global survey in 2020³. It had over a million participants. The survey found that “access to basic services” was the most important issue in the short-term. While environmental and climate issues were most important from a long-term viewpoint. Another recent survey by the United Nations was specifically about climate change⁴𝄒⁵. They surveyed a diverse global group of over a million people. A global average of 64% agreed that climate change was a global emergency. Yet, the global survey showed only a 55% public support for climate policies from high income countries. The support dropped to less than 40% for middle-income countries and the least developed countries. Globally, there was only a 38% public support to mitigate climate change urgently⁶. Global Surveys by IpsosIpsos, a multinational market research and consulting firm, recently undertook a global survey about climate change⁷. The survey showed that about two-thirds of the global population believed that their countries should do more to address the climate challenge. But only 30% of the global average said they would pay more taxes to combat climate change. Another recent global survey by Ipsos was very revealing⁸. The survey asked about the key worries for the population. The top five key worries were inflation, poverty and social equality, crime and violence, unemployment, and corruption. Climate change was ranked eight. The Drivers of the Global PriortiesOverall, the surveys show that the current standard of living is the most urgent issue. Despite the progress over the last decades, the living conditions are still very poor for a large fraction of the global population. The recent information reported by the United Nations is revealing⁹. The data reported was for the year 2022. Inadequate access to basic water services was a major issue¹⁰. Safely managed drinking water was not available to two billion people. Also, over three billion people had no access to safely managed sanitation. Based on the current progress, the United Nations estimates billions will lack such basic water services even in 2030. Access to nutrition was also poor¹¹. Over 700 million people suffered from hunger and over two billion did not have adequate access to food. Access to education was also a major issue¹². Over 40% of the youths did not complete upper secondary school. Access to adequate and clean energy is critical for a good standard of living. But this continues to be an enormous problem¹³. Over 600 million people had no electricity. Over two billion people used highly polluting cooking fuels. Major issues exist with access to healthcare as well¹⁴. A significant fraction of the global population people had no access to vital health services. Five million children died before their fifth birthday because of overall poor conditions¹⁵. Let us consider the impact of climate disasters for reference¹⁶. In the last decade, climate disasters have affected less than 200 million people per year on an average. The average number of deaths has been less than 0.05 million per year. The United Nations data shows that currently the lack of access to basic services is causing far more suffering than climate change. Billions are suffering and millions are dying each year¹⁷. A difficult life is not limited to the most distressed fraction of the population. It is widespread. The living conditions are far from adequate for a major fraction of the global population. According to data from the World Bank, 4.5 billion people live on less than $10/day¹⁸. This meager amount is forcing that population to choose between basic needs such good education, adequate housing, or treatment of health conditions. More than half of the global population is struggling to meet their basic needs. They are in substantial pain. This pain prevents them from being overly concerned about the worsening impacts of climate change. Climate mitigation is not their most urgent issue. Poor living conditions are a far bigger issue for them. The affluent population can easily meet their basic needs. They are not suffering today. So, they are in a better position to worry about the worsening future climate impacts. Yet, climate change is not the topmost concern for all in the affluent category. Some are more concerned about the ballooning national debts, energy security, spiking polarization, erosion of confidence in elections, or rising influence of autocracies. Why? because these issues can also cause extreme disorder in the future. United States is one of the most affluent nations. We will review recent surveys to discuss the voice of its citizens. Dealing with climate change was a top priority for only 37% of the people surveyed¹⁹. It ranked a lowly 17 in a list of 21 issues. Another survey about climate-related spending was also very instructive. A key question in the poll was to identify the support for a law that would increase the average monthly cost by a certain amount to combat climate change. Even a small $1 additional cost per month was only supported by 38% of the people surveyed²⁰𝄒²¹. Concluding RemarksA large majority of the global population is convinced that climate change is a serious problem. But a much smaller fraction believes that it deserves top priority. Why? Because poor living conditions are a far more urgent issue for majority of the global population. Billions of people still cannot even satisfy their basic needs. This makes climate change a lower priority for them. Many in the affluent category are extremely worried about climate impacts. Even so, climate change is not the top concern for all in the affluent category. Some are more concerned about the ballooning national debts, energy security, spiking polarization, erosion of confidence in elections, or rising influence of autocracies. Clear-eyed assessments, including those that reveal inconvenient truths, are important to sustainably address our climate challenges. Note: This is a modified excerpt from my book “The Climate Misinformation Crisis: How to move past the mistruths to a smarter energy future. References & Notes[1] My World: The United Nations Global Survey for a better world. We the peoples. https://www.un.org/youthenvoy/wp-content/uploads/2014/10/wethepeoples-7million.pdf [2] My World: The United Nations Global Survey for a better world. Have your Say. https://vote.myworld2015.org [3] The future we want. The United Nations we need. http://report.un75.online/files/report/un75-report-september-en.pdf [4] United Nations Development Programme Report (2021). People’s climate vote. Results. https://www.undp.org/publications/peoples-climate-vote [5] People from fifty countries too part in the survey. [6] According to the report, an average of 64% believed that climate change was an emergency. Of this subset, 59% agreed that everything necessary must be done urgently. So, the percent of total people that agreed that everything necessary must be done urgently equals 64*59% = 38%. [7] Ipsos Survey (April 2023). Earth day 2023. Public opinion on climate change. https://www.ipsos.com/sites/default/files/ct/news/documents/2023-04/Ipsos%20Global%20Advisor%20-%20Earth%20Day%202023%20-%20Full%20Report%20-%20WEB.pdf [8] Ipsos Survey (March 2023). What worries the world. https://www.ipsos.com/sites/default/files/ct/news/documents/2023-03/Global%20Report%20-%20What%20Worries%20the%20World%20Mar%2023.pdf [9] UN Sustainable Development Goals. Website accessed Nov. 11, 2023. https://www.un.org/sustainabledevelopment/ [10] UN Sustainable Development Goals. Goal 6: Clean water and sanitation https://www.un.org/sustainabledevelopment/water-and-sanitation/ [11] UN Sustainable Development Goals. Goal 2: Zero Hunger. https://www.un.org/sustainabledevelopment/hunger/ [12] UN Sustainable Development Goals. Goal 4: Quality education. https://www.un.org/sustainabledevelopment/education/ [13] UN Sustainable Development Goals. Goal 7: Affordable and clean energy. https://www.un.org/sustainabledevelopment/energy/ [14] UN Sustainable Development Goals. Goal 3: Good health and well-being. https://www.un.org/sustainabledevelopment/health/ [15] UN IGME Report (2022). Levels and trends in child mortality. https://data.unicef.org/resources/levels-and-trends-in-child-mortality/ [16] Our World in data. Natural disasters data explorer. https://ourworldindata.org/natural-disasters The original source of the data is EM-DAT. This is one of the most widely used disaster databases. For example, it is used by United Nation and in numerous academic studies. [17] UN Sustainable Development Goals. Website accessed Nov. 11, 2023. https://www.un.org/sustainabledevelopment/ [18] World Bank data. https://pip.worldbank.org/home Data is in terms of 2017 PPP$. Meaning, it accounts for the difference in the cost of living across countries. I input $10 for the poverty line to get the data. Website accessed on Nov. 11, 2023. [19] Pew Research center. February 2023. Economy remains the publics top policy priority. https://www.pewresearch.org/politics/2023/02/06/economy-remains-the-publics-top-policy-priority-covid-19-concerns-decline-again/ [20] 2023 Associated Press-NORC/EPIC energy survey. Public opinion on energy and climate. https://epic.uchicago.edu/wp-content/uploads/2023/04/EPIC-Energy-Policy-Survey-2023_Topline.pdf [21] Specifically, 16% strongly supported a 1$ additional cost per month while 22% somewhat supported it.  A shift to a low carbon energy system is key to mitigating climate change. Countries across the globe are in the early stages of transforming their energy systems. In this context, it is important to understand the impact of the level of energy use on the standard of living of the global citizens. The standard of living in a country can be numerically discussed in terms of its gross domestic product (GDP) per capita. GDP is the value of goods and services produced in the country. It is commonly used to discuss the economic state of a country. GDP per capita of a country is the GDP of the country divided by its population. Developing countries have a much lower GDP per capita (standard of living) compared to developed countries. Evolution of the standard of living of global citizens over timeIt is helpful to first discuss how the global average standard of living or world GDP/capita has evolved over the past two thousand years. As we can see from the figure, the GDP per capita was almost flat until the last couple of centuries (Figure 1)¹. But after that there was an exponential increase in the GDP per capita. Energy played a major role in this. 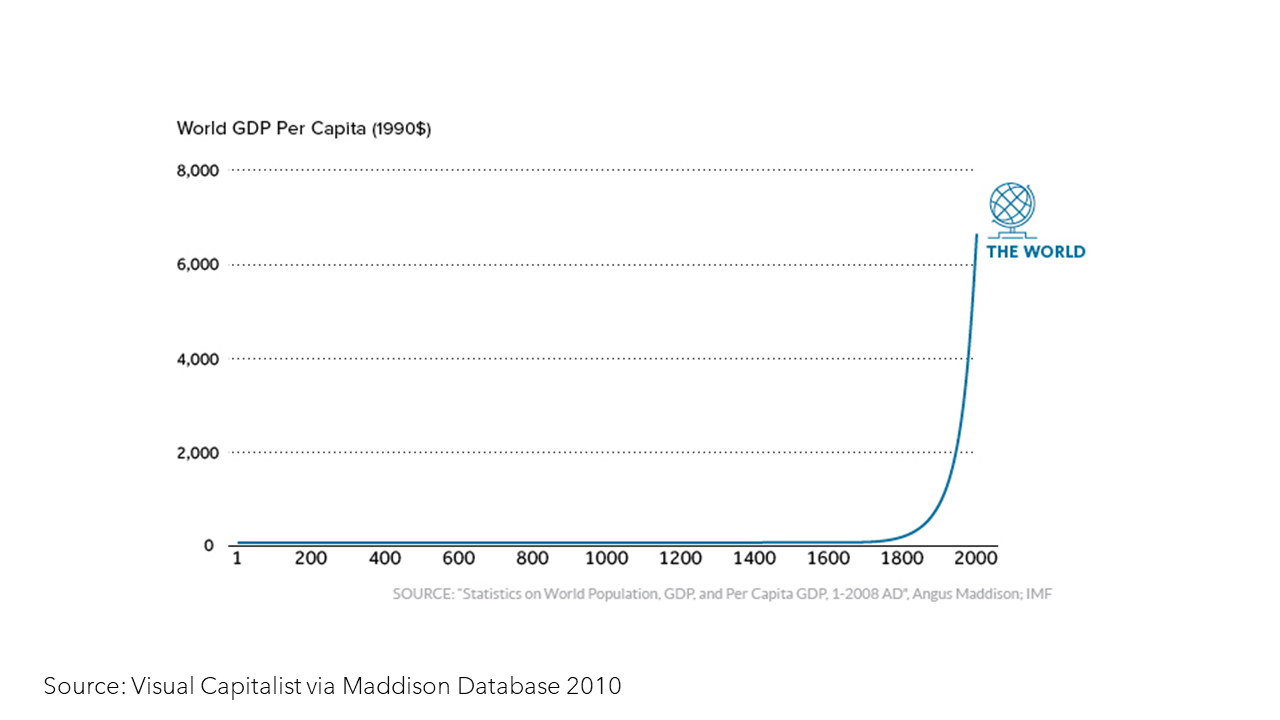 Figure 1. Global GDP per capita over time. Source: Visual Capitalist via Maddison project 2010 For most of human history the primary source of energy was biomass such as wood, waste crop and animal manure. Humans used biomass for heating and cooking. For most other purposes the global society used either human labor or animal labor. Such inefficient use of energy kept the society very busy just meeting basic needs. This limited the progress of the human society. But everything changed after humans learnt how to efficiently harness energy from fossil fuels. Fossil energy was used to fuel machines which could do the work of many men and animals. This mechanization of operations was crucial. Because of this, a much smaller fraction of the population was needed to meet the basic needs of the society. Many now had time for other pursuits, such as making medical and technology advances. There was a further increase in productivity with ongoing technology innovation. The global energy use increased rapidly to support the rise in productivity. This resulted in the exponential increase in global productivity and thereby the standard of living of the global average. The global average data, however, does not provide the complete picture. The progress of the society has not been equal in all countries. Some countries have progressed far more than others. This is because the energy use per capita increased at widely different rates across the globe. For example, the rate of increase was markedly higher in European countries and the United States. However, the rate of increase was much slower in many countries in Africa, Asia, and South America. Recent data for more than 170 CountriesThe rate of the increase in the use of energy per capita has varied widely across the globe over the past two centuries. So, currently there is a very wide variation in the energy use per capita amongst the different countries. The wide variation is energy per capita has resulted in a wide variation in the standard of living (GDP/capita). The relation between GDP per capita, and energy use per capita of over 170 countries across the globe for the year 2021 is shown in Figure 2²𝄒³. The relation is interesting. 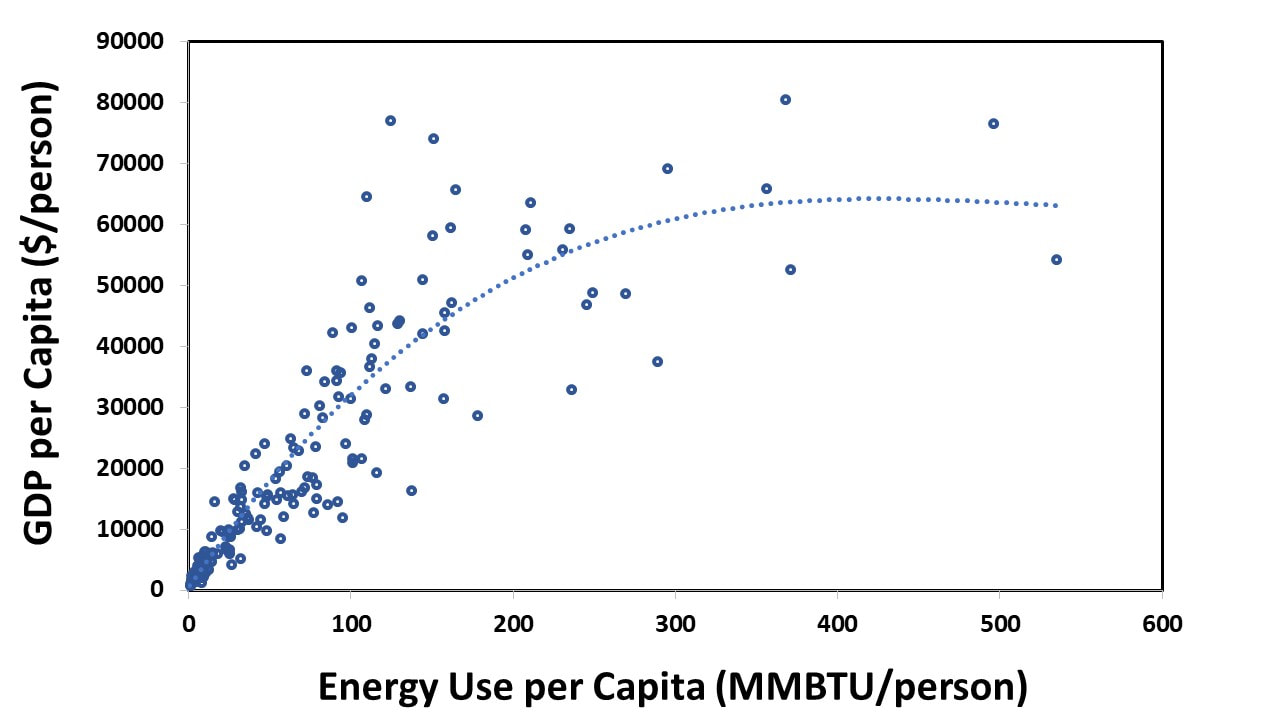 Figure 2. Data from more than 170 countries showing the relation between their standard of living (GDP per capita) and energy use per capita. Data is for the year 2021. Data Source⁴𝄒⁵ The World Bank and U.S. EIA A strong linear correlation is observed until a certain level of energy use per capita is achieved by a country. I will refer to this level as the poverty-buster level. The data shows the poverty-buster level is 80 million BTU of energy use per person. For reference, 1 million BTU = 293 kWh. High-income countries or advanced economies use far more than this level of energy. The figure shows that the GDP per capita correlates very strongly with energy per capita for low- and mid-income countries. The human development index also correlates strongly with energy per capita in case of low- and mid-income countries⁶𝄒⁷. This index includes key dimensions of human development such as a long and healthy life, good education, and a decent standard of living. Developed countries have a high GDP per capita because of their high energy use. But many developed countries use far more energy than the poverty-buster level of 80 million BTU per person. The GDP per capita is less sensitive to the energy per capita beyond the poverty-buster level. But a major fraction of the global population lives in countries where the energy use is below the poverty-buster level of 80 million BTU per person. For example, the energy per capita in India is less than 25 million BTU per person⁸. So, its energy use per capita is far below the poverty-buster level. Even a moderate increase in the energy use in such countries will lead to a substantial increase in their GDP per capita. This means a much better standard of living and human development index. Case Study: Comparison of China with IndiaThe case of China and India is useful to discuss the importance of increasing the energy use in developing countries. Both India and China had a similar GDP per capita in 1990⁹. China increased its energy use per capita almost twice as fast as India since 1990. Figure 3 shows the massive benefit to China’s GDP per capita because of the faster increase in its energy use. 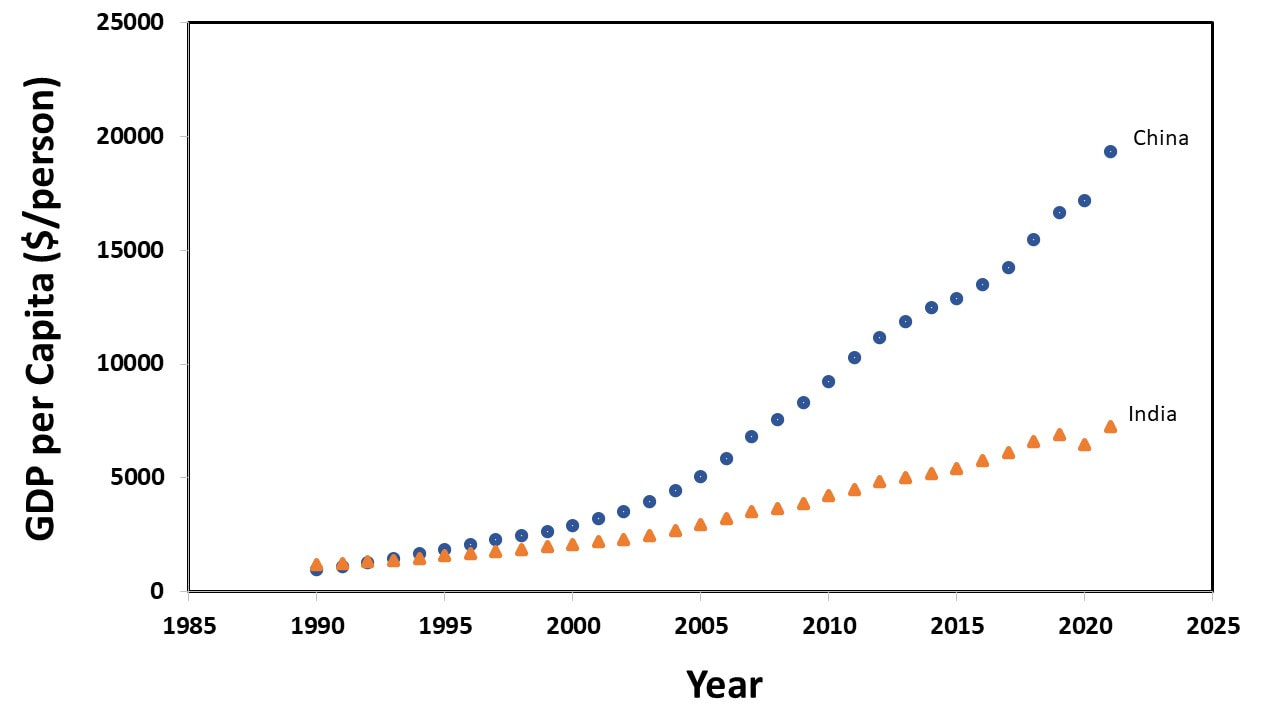 Figure 3. Comparison of GDP per capita between India and China since the year 1990. Data Source¹⁰: The World Bank. Implications
The data discussed in the earlier section has critical implications. Most developing countries will need to markedly increase their energy use to achieve a decent standard of living for their citizens. More than half of the global population currently lives on less than $10 per day¹¹. Most of this population lives in developing countries. Adequate access to low-cost energy is crucial to the progress of developing countries. The situation is different for developed countries. They already have an excellent standard of living because of high energy use. These countries have an energy per capita that is far more than the poverty-buster level. The standard of living in such countries will not improve much by a further increase in energy use. Countries with a very high energy per capita can decrease their energy use substantially without a major compromise to their standard of living or human development index. Note: This is a modified excerpt from my book “The Climate Misinformation Crisis: How to move past the mistruths to a smarter energy future. References & Notes[1] Visual Capitalist via Maddison database 2010. https://www.visualcapitalist.com/2000-years-economic-history-one-chart/ Maddison Database 2010. https://www.rug.nl/ggdc/historicaldevelopment/maddison/releases/maddison-database-2010?lang=en. [2] U.S. EIA. International Data. Energy Intensity. https://www.eia.gov/international/data/world/other-statistics/energy-intensity-by-gdp-and-population? [3] World Bank data. GDP per capita, PPP (current international $). https://data.worldbank.org/indicator/NY.GDP.PCAP.PP.CD Use of GDP data in terms of PPP accounts for the difference in purchasing power of the different countries. [4] World Bank data. GDP per capita, PPP (current international $). https://data.worldbank.org/indicator/NY.GDP.PCAP.PP.CD [5] U.S. EIA. International Data. Energy Intensity. https://www.eia.gov/international/data/world/other-statistics/energy-intensity-by-gdp-and-population? [6] UNDP. Human development reports. https://hdr.undp.org/content/energising-human-development [7] Our World in data. Human development index vs GDP per capita, 2021. https://ourworldindata.org/grapher/human-development-index-vs-gdp-per-capita [8] U.S. EIA. International Data. Energy Intensity. https://www.eia.gov/international/data/world/other-statistics/energy-intensity-by-gdp-and-population? [9] World Bank data. GDP per capita, PPP (current international $). https://data.worldbank.org/indicator/NY.GDP.PCAP.PP.CD [10] World Bank data. GDP per capita, PPP (current international $). https://data.worldbank.org/indicator/NY.GDP.PCAP.PP.CD [11] World Bank data. https://pip.worldbank.org/home Data is in terms of 2017 PPP$. It accounts for the difference in the cost of living across countries. I input $10 for the poverty line to get the data. 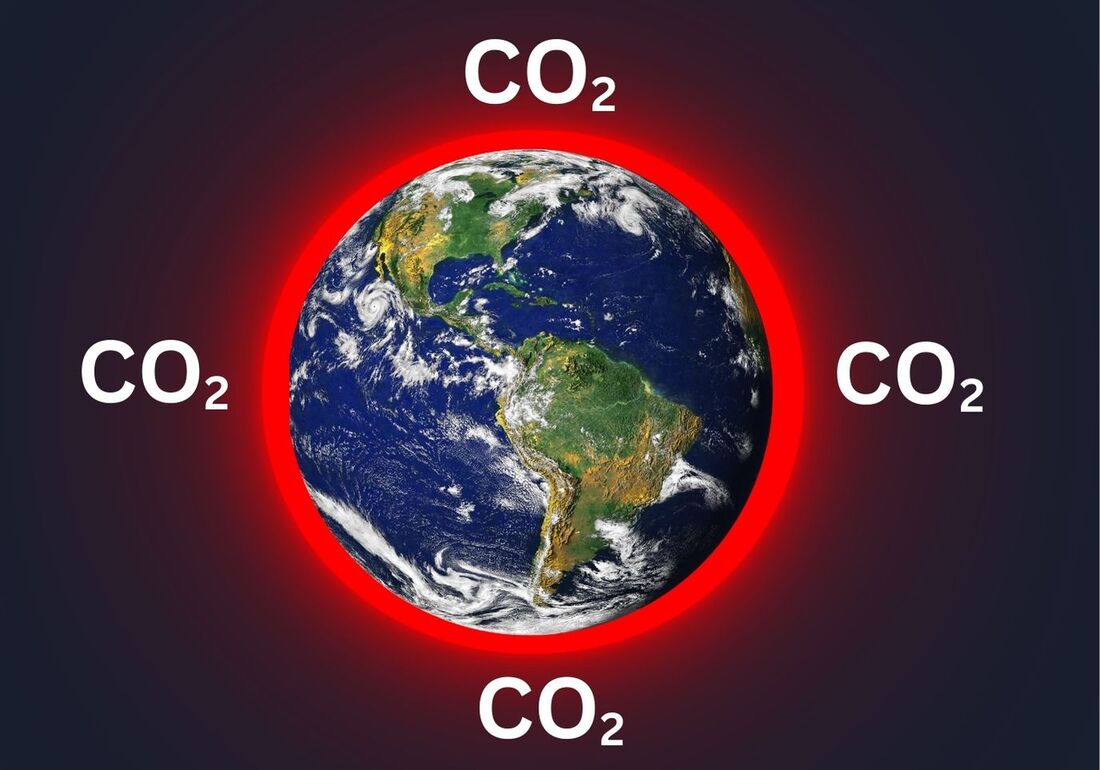 Even today, a significant number of people are convinced that the CO₂ emitted by humans is not warming our planet. Several incorrect beliefs fuel this conviction. 1. Some believe that the observed warming is the result of an increase in solar energy received by earth. 2. Some point to the very low content of CO₂ and the high content of water vapor in the atmosphere. 3. Some believe that the temperature rise is because of the urban heat island effect. 4. Some suggest that CO₂ cannot be a problem because plants require CO₂. We will review the shortcomings of these beliefs in this article. Is global warming a result of the change in the solar energy received by earth?If this was true, the change in global temperature would correlate with the change in solar energy over time. Figure 1 compares the change in solar activity over time with the change in global temperature. 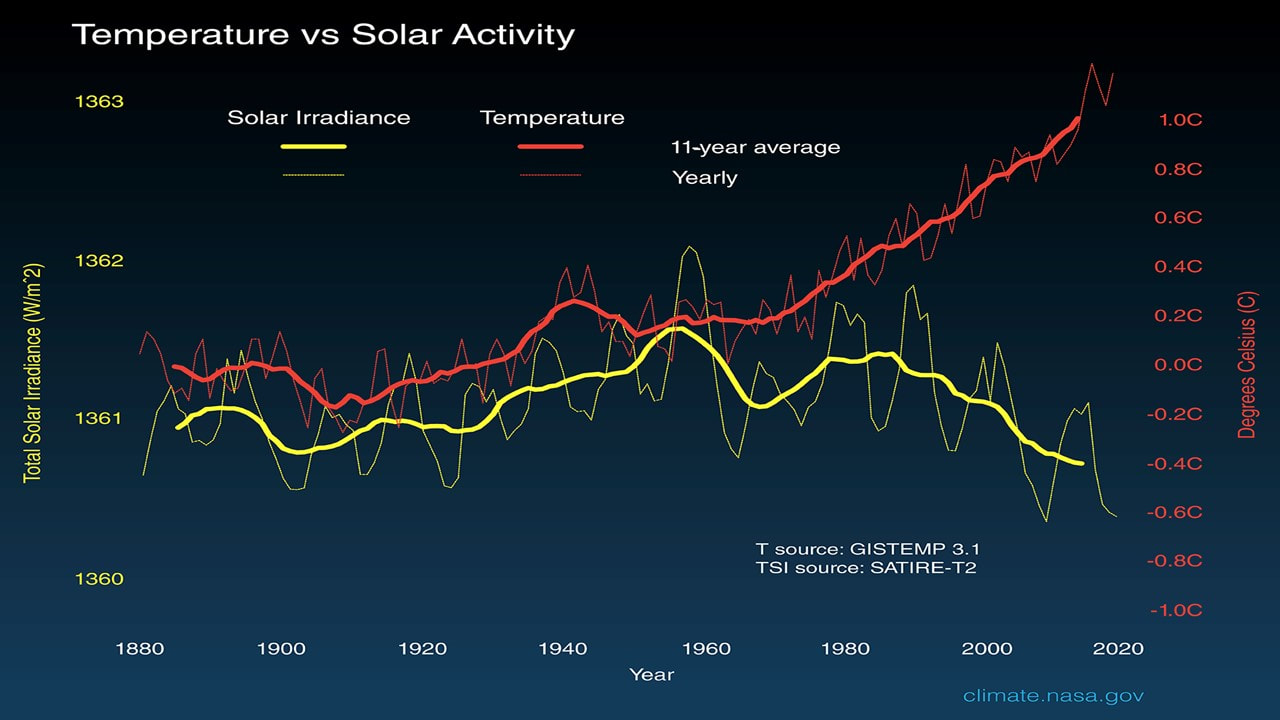 Figure 1 Comparison between the changes in the global surface temperature and sun’s energy (solar irradiance) received by earth. Data Source[1]: NASA-JPL/Caltech
The solar energy information is presented in terms of solar activity or total solar irradiation. The figure shows that the global temperature has increased markedly since the year 1960. But there has been no concurrent increase in the solar energy received by earth. In fact, there has been a slight decrease in the solar energy received by earth. This shows that an increase in solar energy is not responsible for the warming. What about the role of CO2 and water vapor? As a start, let us review some basic science about greenhouse gases. Atmospheric greenhouse gases such as water vapor and CO2, provide a blanketing effect over earth because of their ability to trap heat. If our atmosphere did not have greenhouse gases, more heat energy would have escaped back into space. This would have resulted in a hostile temperature of -18oC on earth[2]. The temperature is 33oC higher because of the greenhouse gases. Thus, greenhouse gases are responsible for the comfortable temperature on earth. Earth’s heat balance depends on the greenhouse gas content of the atmosphere. Human activities can disturb our planet’s delicate heat balance by increasing the greenhouse gas content[3]. The average temperature of earth has increased by over 1.1 degree C since the industrial revolution. This increase is consistent with the basic science of greenhouse gases[4]. But there is an important difference between the impact of water vapor and CO2. Water vapor is the major greenhouse gas component in the atmosphere. Yet it only plays an indirect role in the earth’s temperature rise[5]. CO2 on the other hand plays a primary role. Let us examine the reasons below. CO2 is a non-condensable, long-lived gases. For example, some of the CO2 can remain in the atmosphere for over a hundred years[6]. Unlike CO2, water vapor is a condensable gas that can easily convert back to water. The temperature of the air determines how much water vapor it can hold. Specifically, air at higher temperature can hold a higher water vapor content. So, the impact of water vapor depends on the temperature. Human activities release CO2 from activities such as burning fossil fuels. As CO2 is long-lived, it accumulates in the atmosphere. This increases its atmospheric content and blanketing effect. This, in turn, increases the earth’s temperature. The rise in earth’s temperature because of the additional CO2 results in extra water vapor in the atmosphere. The greenhouse effect from this extra water vapor further increases earth’s temperature[7]. In other words, the extra impact of water vapor is a result of the accumulation of long-lived greenhouse gases in the atmosphere. The extra impact would not exist if the content of the long-lived gases such as CO2 did not increase in the atmosphere. Let me summarize. The accumulation of CO2 increases the temperature content. This, in turn, increases the water vapor content. So, the impact of the additional water vapor only exists because of the increase in CO2 and the other long-lived gases[8]. That is why the focus is on the long-lived greenhouse gases such as CO2. The CO2 content in the atmosphere is 0.04%[9]. How does such a small amount have such a large impact? Because the impact of a substance does not depend only on its quantity. It also depends on its properties. For example, the legal blood alcohol content for vehicle drivers in most countries is between 0.01 to 0.08%[10]. This is because of the properties of alcohol. Even levels of blood alcohol as low as 0.05% can impair human abilities[11]. Similarly, the large impact from greenhouse gases-at very low levels-is because of their powerful ability to trap heat. Recall, CO2 is also responsible for increasing the greenhouse gas effect from water vapor. What about the urban heat island effect? Is it the cause for the observed warming trend as opposed to CO2? We will review why that is not the case below. An urban area is warmer than the adjacent rural areas. This urban heat island effect is because of some specific features[12]. An urban area has fewer natural landscapes such as vegetation and water bodies that can cool the surroundings. Urban materials such as pavements, roads, and rooftops add to the heat effect because they absorb and emit more of the sun’s heat. The large concentration of human activities in an urban area also contributes to the heat effect. But the urban heat island effect is not the cause for the global warming trend[13]. How do we know that? Because scientists can separate these local effects from the long-term global warming trends. Scientists have known about the urban island heat effect for a long time. They account for the effect in their analysis[14]. The scientific community has concluded that the urban heat island effect has a negligible effect on the average global temperature rise[15]. What about plants and the levels of CO2? Plants require CO2 for photosynthesis. Humans have emitted over 2000 billion tons of CO2 over the past few centuries[16],[17]. The current CO2 levels are higher than any time in the past eight hundred thousand years[18]. Studies show that the increase in CO2 is having a fertilization effect on plants[19]. But plants and oceans can only absorb half of the extra CO2 emissions[20]. The other half accumulates in the atmosphere. This accumulation is upsetting the heat balance of our planet. It is causing a long-term increase in temperature and shift in weather patterns. Over time, the increase in heat waves and unusual precipitation is expected to have a strong negative impact on agriculture[21]. Scientists have weighed the benefits and negative effects from the rise in CO2 levels. They have concluded with high confidence the excess CO2 in the atmosphere overall is having an overwhelmingly negative impact on our ecosystems[22]. [1] NASA Global Climate change. Graphic temperature vs solar activity. https://climate.nasa.gov/climate_resources/189/graphic-temperature-vs-solar-activity/ [2] NASA global climate change. What is the greenhouse effect? https://climate.nasa.gov/faq/19/what-is-the-greenhouse-effect/ [3] U.S. Department of Energy (DOE): DOE explains the carbon cycle. https://www.energy.gov/science/doe-explainsthe-carbon-cycle [4] IPCC: AR6. Climate Change 2021: The Physical Science Basis. Figure SPM1.b: Change in global surface temperature relative to 1850-1900. https://www.ipcc.ch/report/ar6/wg1/downloads/report/IPCC_AR6_WGI_SPM_final.pdf [5] American Chemical Society. Myth: Its water vapor not the CO2. https://www.acs.org/content/acs/en/climatescience/climatesciencenarratives/its-water-vapor-not-the-CO2.html [6] US EPA: Climate change indicators- Greenhouse gases. https://www.epa.gov/climate-indicators/greenhouse-gases [7] Such an effect is described as positive feedback, i.e., a response that increases the temperature. [8] This is another way of looking at this issue. Removal of the long-lived gases contributed by the human society will decrease the earth’s temperature. This will decrease the water vapor content, which will further decrease the earth’s temperature. [9] NOAA Climate.gov. Climate change: Atmospheric carbon dioxide. https://www.climate.gov/news-features/understanding-climate/climate-change-atmospheric-carbon-dioxide The CO2 content of the atmosphere is 420 ppm currently. [10] World health organization (WHO). Legal BAC limits by country. https://apps.who.int/gho/data/view.main.54600 [11] National Safety Council. https://www.nsc.org/getmedia/9f523dba-b7ec-4c66-9f7c-f360e4ea45dd/low-alcohol-risk.pdf.aspx Centers for disease control and prevention (CDC). Impaired driving. https://www.cdc.gov/transportationsafety/impaired_driving/states.html [12] U.S. EPA. Learn about heat islands. https://www.epa.gov/heatislands/learn-about-heat-islands [13] NASA. Global climate change. Can you explain the urban heat island effect? https://climate.nasa.gov/faq/44/can-you-explain-the-urban-heat-island-effect/ [14] IPCC Sixth Assessment Report (2021). Working Group I. The Physical science basis. https://www.ipcc.ch/report/ar6/wg1/downloads/faqs/IPCC_AR6_WGI_FAQ_Chapter_10.pdf [15] IPCC Sixth Assessment Report (2021). Working Group I. The Physical science basis. Regional Fact sheets. Urban areas. https://www.ipcc.ch/report/ar6/wg1/downloads/factsheets/IPCC_AR6_WGI_Regional_Fact_Sheet_Urban_areas.pdf AR4(2007): https://archive.ipcc.ch/publications_and_data/ar4/wg1/en/ch3s3-2-2-2.html [16] Earth system science data. Global carbon budget 2020. Vol. 12, Page 3269, Year 2020. https://essd.copernicus.org/articles/12/3269/2020/ [17] IPCC Special Report: Global warming of 1.5 oC. Chapter 2. Figure 2.3 https://www.ipcc.ch/sr15/chapter/chapter-2/ [18] NASA Global climate change. Graphic: the relentless rise of CO2. Data: Data: Luthi, D., et al. 2008; Etheridge, D.M., et al. 2010; Vostok ice core data/J.R. Petit et al.; NOAA Mauna Loa CO2 record. https://climate.nasa.gov/climate_resources/24/graphic-the-relentless-rise-of-carbon-dioxide/ [19] NASA. Carbon dioxide fertilization green earth: Study funds. https://www.nasa.gov/feature/goddard/2016/carbon-dioxide-fertilization-greening-earth [20] NOAA. Science on a sphere. Ocean-atmosphere CO2 exchange. https://sos.noaa.gov/catalog/datasets/ocean-atmosphere-CO2-exchange/ [21] IPCC Special Report on Climate change and land. Chapter 5. Food security. https://www.ipcc.ch/srccl/chapter/chapter-5/ [22] IPCC AR6 Synthesis Report Climate change 2023. https://www.ipcc.ch/report/sixth-assessment-report-cycle/  Influential academic papers and aspirational proposals either ignore or assume away the extraordinary challenges of a net zero energy transition by 2050. Such unrealistic reports are misleading the public and policy makers.
Fossil fuels contribute to over 75% of the global greenhouse gas emissions¹. A rapid shift to low carbon energy is highly desirable to minimize the impacts of climate change. Consequently, proposals that target a net zero energy system by 2050 are receiving wide attention²𝄒³. Per the recommendation of climate experts, these proposals are designed to limit the global temperature rise to 1.5ᵒC⁴. The net zero proposals advocate a complete shift to a low carbon energy system in less than thirty years. Many climate activists believe that such a rapid energy transition is not very difficult. They believe that the main challenge is a lack of political will. We will see below how such beliefs contradict basic facts. Comparison with the Previous Energy TransitionThe previous energy transition involved a shift from traditional biomass to fossil fuels. It is interesting to compare the low carbon transition to the previous energy transition. An energy transition has three key attributes. They are speed, size, and convenience offered by the new energy system. These attributes define the level of the challenge for the transition. We will see how the low carbon transition compares with the previous transition for each of these attributes. Speed is a key attribute because it defines the rate at which new resources will be needed to support the transition. Currently, low carbon technologies contribute to less than 20% of the global energy⁵. Influential proposals have a target of reaching net zero emissions by the year 2050⁶𝄒⁷. The proposal is to shift almost completely to a low carbon energy system over the next three decades. How does the proposed speed compare with the transition from traditional biomass to fossil fuels? It took over a hundred years for the shift to fossil fuels⁸. So, the net zero proposals are endorsing a speed that is over three times faster than the previous transition⁹. The low carbon transition also differs in terms of the size or the amount of global energy use. This key attribute defines the quantity of resources required for the transition. The energy requirements for the current transition are substantially higher than that of the previous transition⁹𝄒¹⁰. The low carbon transition also differs from the prior energy transition in terms of the convenience offered to society. A superior convenience leads to a higher acceptance by the consumers. Fossil fuels can provide plentiful energy in a manner that is easy to use. The shift from biomass to fossil fuels markedly increased the convenience of energy use. Such an advantage does not exist for a low carbon energy system. The best-case scenario for low carbon energy will be to provide comparable convenience to a fossil fuel-based energy system. A direct comparison with the previous transition is revealing. The speed proposed for the low carbon transition is over three times faster, the size is larger, and there is no advantage from a convenience viewpoint. Note: The above comparsion cannot be used to make any conclusions. But it is always a good idea to understand the past. The Low Carbon Transition Will Require Many Extraordinary ChangesA recent report by the International Energy Agency (IEA) has detailed the major changes in the energy sector that will be required to target net zero by 2050¹¹𝄒¹²𝄒¹³. We will review the highlights of the required changes and discuss why these changes are extraordinary. The share of low carbon energy is currently less than 20%. The net zero proposal by IEA requires an almost complete shift to low carbon energy by 2050. Why is this extraordinary? Because the share of low carbon energy has only increased from 13% to 18% over the last three decades¹⁴𝄒¹⁵. The global electricity networks will need to more than double over the next thirty years. Why is this extraordinary? Because the existing global networks took over a hundred years to build¹⁶. For reference, the total length of transmission circuits and distribution grids is over 80 million kilometers¹⁷𝄒¹⁸. The annual electricity produced from solar and wind power will need to grow from the current 3500 TWh to 55,000 TWh by 2050. Why is this extraordinary? Because the global annual electricity from all sources combined only increased by 6000 TWh in the last ten years and 17,000 TWh over the last thirty years¹⁹. Battery storage will need to increase to 4200 GW by 2050. This is extraordinary considering that the existing capacity is less than 50 GW. The current levels of low carbon energy use are very low²⁰. An extraordinary growth will be required in all the energy areas by 2050²¹. The annual production of hydrogen from low carbon sources will need to increase from the current trivial amounts to over 400 million tons²². The share of low carbon emissions steel and cement will need to increase from 0% to over 90%. The share in the sales of low carbon buses will need to increase from 4% to 100%. The share in the sales of low carbon freight trucks will need to increase from 1% to 100%. The public EV chargers will need to increase from 3 million to over 30 million units. The share of low carbon ships will need to increase from 0% to 85%. The share of low carbon air travel will need to increase from 0% to 70%. The share of buildings that can support zero carbon will need to increase from the current trivial levels to over 80%. The total CO₂ captured will need to increase from 45 million tons to 6000 million tons. Extraordinary Changes@Rapid Pace = Extraordinary ChallengesEnergy drives our world. We use more energy annually than plastics, steel and cement combined. An overhaul of our energy system is an overhaul of how we produce, travel, and live. As discussed in the previous section, a transition to low carbon energy by 2050 will require many extraordinary changes. Why is this indicative of many extraordinary challenges? Because such changes will require extraordinary amounts of resources at a rapid pace. Resources include critical minerals, materials, land, energy, water, and skilled workers. We will examine the challenges associated with some of the resources next. The Critical Minerals ChallengeLow carbon technologies require several times more critical minerals than fossil fuel technologies. Solar power requires sixteen times more critical minerals compared to fossil fuel power to produce the same amount of lifetime electricity²³𝄒²⁴. Onshore wind power requires twelve times more critical minerals while offshore wind requires fourteen times more. An electric car requires six times more critical minerals than a conventional car. A heat pump requires seven times more critical minerals than a conventional gas boiler. The proposed increase in low carbon energy will lead to a massive increase in the demand for critical minerals (Figure 1). The situation will be extreme for certain critical minerals such as lithium, nickel, cobalt, and neodymium. By the year 2030, low carbon technologies alone will need these minerals in quantities that are equivalent or more than the current total global production²⁵𝄒²⁶𝄒²⁷. Such requirements are unprecedented. Figure 1. The increase in demand for critical minerals from 2021 to 2030 for the IEA net zero by 2050 pathway. Data Source²⁸: IEA Many new mining projects will be required to provide the critical minerals required for a net zero world. Recent global data for relevant critical minerals shows an average of twenty years of lead time for a new mining project²⁹. Exploration takes about twelve years. Construction of the mine and ramping up production requires another eight years. Such projects carry a high financial risk. A recent analysis by IEA shows that the anticipated supply of key critical minerals in the year 2030 will be well below the demand set by the net zero target³⁰. A rapid energy transition requires rapid access to massive amounts of critical minerals. The long lead times of new mining projects and high financial risk are extraordinary challenges for such access. Facts on the ground tell us that the global society will very likely not be able to meet the critical minerals challenge. The Land Resource ChallengeWhat about land resources? Solar and wind power plants require far more land than natural gas and coal power plants³¹. A solar power plant requires over a hundred times more land to produce the same amount of lifetime electricity as a natural gas plant. A wind farm requires over a thousand times more land. Total land requirements will be large because of the gigantic increase in solar and wind power. For example, the IEA net zero proposal calls for the electricity from solar and wind power to increase by a factor of fifteen by the year 2050. This equates to solar and wind power generating two timesmore electricity than that generated by all the sources combined today. For reference, solar and wind power contribute to less than 15% of the electricity generated today³². The challenge is not that there is not enough land. The challenge is about the practical access to the required land at the desired locations. The solar and wind projects often need to be sited close to the population centers for economic and other practical reasons. Many people are opposed to having such projects close to where they live. This is already having a major impact. Globally, there is an increasing level of such “not in my backyard (NIMBY)” attitude. Energy projects are increasingly seeing pushbacks from the local population. This is of major concern because the energy transition has large land requirements. New renewables projects and new mines will require vast areas of land. The pushbacks from the local population will make it extremely difficult to get timely access to the required land. A recent Columbia Law school study of the situation in the United States is revealing³³. Renewable energy projects have faced significant opposition in 45 states. Over two hundred local laws and policies have been issued in 35 states to restrict renewable energy projects. The NIMBY problem has been on the rise globally. This problem impacts all projects, not just low carbon energy projects. But the challenge is extraordinary for the low carbon energy transition because of its massive land requirements. Very few renewable projects have been deployed compared to what is proposed in the future. Even so, the opposition for the projects has been significant. Several times higher deployment is being proposed over the next three decades. This will markedly increase the severity of this challenge. There is no evidence to suggest that the global energy projects will have access to the required land in a timely manner. The Skilled Workforce ChallengeThe requirement of a very large skilled workforce also presents an extraordinary challenge. Tens of millions of skilled workers will be required for the shift to low carbon energy³⁴. A shortage of workers is already being observed at the current levels of deployment. A recent report by IEA has captured some of these issues³⁵. Europe and United States have a shortage of plumbers, pipefitters, electricians, heating technicians and construction workers. China is struggling to fill positions in its factories³⁶. Such shortages are already restricting the pace of the shift. This challenge will rapidly increase because of the stress from the rapid deployment speeds that are being proposed. China’s ministry of education has predicted a huge talent gap by the year 2025. It has predicted a talent gap of over 9 million people in power equipment, over 1 million in clean vehicles and more than a quarter of a million in offshore equipment. The following quote in a recent article from the consulting firm McKinsey and Company is relevant³⁷. “McKinsey estimates that the global installed capacity of solar and onshore and offshore wind projects will have quadrupled from 2021 to 2030. This huge surge in new wind and solar installations will be almost impossible to staff with qualified development and construction employees as well as operations and maintenance workers.” Facts on the ground are not looking positive for this extraordinary challenge as well. The Technology Gap ChallengeThe proposed energy transition has a technology availability problem. According to a recent update from IEA³⁸, technologies required to reduce 35% of the CO₂ in a net zero world are still not available on the market³⁹. They are still in the prototype or demonstration stages. These technologies will be required to address applications such as steel and cement production, ships, aircraft, and long duration energy storage. These technologies have far more challenges than solar and wind power, heat pumps, and electric cars. That is why they are still in the demonstration or prototype stages. I will call these difficult technologies hereafter. The difficult technologies will need to be available on a wide scale in a couple of decades to be consistent with the net zero by 2050 proposals. To be available on a wide scale, a new technology has to satisfy two crucial conditions. The new technology will need to be available at a comparable cost to the incumbent. Also, it will need to provide a similar convenience to the user. What does history tell us about the time required for a new energy technology to move from a demonstration stage to a significant market share? The 2023 IEA Technology Perspectives report provides this information⁴⁰. For wind power, it took over 30 years. For solar power, it took over 50 years. And it took 30 years for lithium-ion battery. Many of the difficult technologies have only been in the demonstration stages for a decade or less. How much time will be required for these technologies to reach a wide scale use? No one can accurately predict the time required for major innovations. But we can guess based on historical data. The easier technologies such as solar and wind power took between 30 to 60 years to reach a significant market share. Therefore, the difficult technologies are likely to take a few to several decades to reach a major share of the market. This timeframe is not consistent with the proposed rapid energy transition. The Energy Security ChallengeGeographical diversity of energy resources is crucial for global energy security. Critical minerals, which are required for low carbon technologies, have very poor diversity. The top producing country has more than half of the share of the extraction of rare earths, cobalt, lithium, and platinum (Figure 2)⁴¹𝄒⁴². Figure 2. The global share of the top producing country for key critical minerals. Data Source⁴³: IEA The critical minerals require a processing step following their extraction. The processing of critical minerals is even less diverse. China has a dominant share in all aspects. It has a very large share in either the extraction or processing of many critical minerals. Chinese companies have also made major investments in countries–such as Australia, Chile, Congo, and Indonesia–that produce critical minerals. China also dominates the mass manufacturing of low carbon technologies. China’s domination of the entire supply chain is because of its unique conditions such as a) access to a cheap and large workforce, b) the powerful influence of an autocratic government and, c) access to mineral resources. Such dominance of China is alarming. Other nations are very unlikely to diminish China’s domination in the foreseeable future. This situation is a major concern for the global energy security. The geographical diversity of the entire low carbon energy supply chain will need to diversify substantially to address this problem. To be consistent with the proposed rapid transition, this must be achieved in a decade or so. Recall, China’s domination in this space is because of several unique conditions. There is no evidence to indicate that the diversification can be achieved in a reasonable timeframe. This is yet another extraordinary challenge which the global society does not have a good answer for. The International Cooperation ChallengeA high level of international cooperation is crucial for a rapid energy transition. IEA estimates that a low level of international cooperation can delay the transition by four decades⁴⁴. Why is this an extraordinary challenge? Because each country has its own challenges, politics and agenda. The conflicting interests and priorities of the countries make it very challenging to maintain a high level of co-operation. This is especially difficult for countries that have a very different governing structure such as a democracy vs. an autocracy. The challenges related to high international co-operation are clear from the global conflicts,⁴⁵ trade wars⁴⁶ and unequal access to covid vaccines across the globe. For example, there was inadequate co-operation about covid vaccines even though tens of millions of lives were at stake⁴⁷𝄒⁴⁸. The international co-operation was low despite the obvious and acute importance. This is very revealing. There is no evidence to suggest that a high-level of global cooperation is likely in the required timeframe. Final RemarksA rapid energy transition has many extraordinary challenges. There is no evidence to suggest that the global society will be able to meet all of these challenges. The evidence points to the contrary. Facts on the ground tell us that several miracles will be required to meet the aspirational targets. Yet, several influential entities believe that a rapid transition is not that difficult. They believe so because they either ignore the challenges or irrationally assume that the global society will somehow overcome the challenges⁴⁹. The wide reach of such influencers has caused a lot of confusion, anxiety, and hatred in the public. Many now believe that a rapid energy transition is straight forward but for the greedy forces that are not allowing it to happen. The reality is that a rapid energy transition has many extraordinary challenges. These challenges cannot be wished (assumed) away as is often done in academic papers or ambitious net zero proposals⁴⁹. Aspirational targets that do not give due respect to these extraordinary challenges will guarantee a poor outcome. Key issues-such as timely access to critical minerals, land and skilled workforce, wide availability of difficult technologies, global politics, and energy security-must be carefully considered. There is significant confusion about our past achievements. Our society has made major advances in information technology, medicine, electronics, satellites, and space travel over the past few decades. But these advances required trivial resources compared to the proposed low carbon transition. The proposed transition involves a complete overhaul of the global energy system. This basically means a complete overhaul of how we do things today. The scope and complexity of the proposed transition is extraordinary because it very rapidly requires an unprecedented level of physical resources and global cooperation. The global society has never undertaken a task of such scope and complexity. The energy transition poses several unprecedented challeneges. So, a robust proposal must include a rational discussion about how all the challenges will be addressed. This is the only route to efficiently address climate change. I will discuss one possible path in one of my upcoming articles. Note: This is a modified excerpt from my book “The Climate Misinformation Crisis: How to move past the mistruths to a smarter energy future” References & Notes[1] United Nations. Climate action. Causes and effects of climate change. https://www.un.org/en/climatechange/science/causes-effects-climate-change# [2] IEA: United Net zero by 2050. https://www.iea.org/reports/net-zero-by-2050 [3] IRENA: World transitions outlook: 1.5oC pathway. https://irena.org/publications/2021/Jun/World-Energy-Transitions-Outlook [4] United Nations. Climate action. For a livable planet: Net-zero commitments must be backed by credible actions. https://www.un.org/en/climatechange/net-zero-coalition# [5] U.S. EIA: Primary energy. Note, this data is based on a fossil fuel equivalence (or substitution) method for renewable energy. So, this is a reasonable apples-to-apples comparsion. https://www.eia.gov/international/data/world/total-energy/total-energy-consumption? [6] International Energy Agency Report, 2021. Net zero by 2050: A roadmap for the energy sector. https://www.iea.org/reports/net-zero-by-2050 [7] International Renewable Energy Agency. World Energy transitions outlook: 1.5oC pathway. https://www.irena.org/publications/2021/Jun/World-Energy-Transitions-Outlook [8] Our World in Data. Global direct primary consumption. Historical data from the site is available only in this format. Note: The basic conclusion does not change when considering the heat loss associated with fossil fuel power and other energy applications. https://ourworldindata.org/grapher/global-primary-energy?country=~OWID_WRL [9] This informtion considers the thermodynamic inefficiencies of fossil fuels and related technologies. [10] Our World in Data. Global direct primary consumption. Historical data from the site is available only in this format. For the 2050 energy use, I consider the total final consumption from the IEA report (Updated Net zero by 2050: see next reference) which accounts for the heat loss associated fossil fuel power and other energy applications. https://ourworldindata.org/grapher/global-primary-energy?country=~OWID_WRL [11] IEA Updated 2023 report: Net zero by 2050. https://www.iea.org/reports/net-zero-roadmap-a-global-pathway-to-keep-the-15-0c-goal-in-reach [12] International Energy Agency Report, 2021. Net zero by 2050: A roadmap for the energy sector. https://www.iea.org/reports/net-zero-by-2050 [13] IEA Report. Energy Technology Perspectives 2023. https://www.iea.org/reports/energy-technology-perspectives-2023# [14] U.S. EIA data. Primary energy. Note, this data is based on a fossil fuel equivalence (or substitution) method for renewable energy. So, this is a reasonable apples-to-apples comparsion. https://www.eia.gov/international/data/world/total-energy/total-energy-consumption? [15] The final energy consumption (or useful energy) estimated for the year 2050 by IEA and IRENA for their net zero pathways is still quite high despite the converion to a low carbon energy system that has far higher thermodynamic efficiencies (little to no no heat loss). This is because the population, economy and thereby the global energy consumption is expected to grow markedly over the next three decades. [16] IEA Report. Net zero by 2050. A roadmap for the energy sector. Page 119. https://www.iea.org/reports/net-zero-by-2050 [17] IEA Report. Energy Technology Perspectives 2023. Page 283. https://www.iea.org/reports/energy-technology-perspectives-2023# [18] Data Brief. A global inventory of electricity infrastructures from 1980 to 2017. Volume 38. Page 107351. Year 2021. https://www.ncbi.nlm.nih.gov/pmc/articles/PMC8441158/pdf/main.pdf [19] U.S. EIA data. Electricity data. https://www.eia.gov/international/data/world/electricity/electricity-generation [20] The data for current levels is from the year 2022 (i.e., the most recent available data). IEA data. Tracking clean energy progress 2023. https://www.iea.org/reports/tracking-clean-energy-progress-2023 [21] IEA Updated 2023 report: Net zero by 2050. https://www.iea.org/reports/net-zero-roadmap-a-global-pathway-to-keep-the-15-0c-goal-in-reach [22] IEA data. Global hydrogen review 2022. https://www.iea.org/reports/global-hydrogen-review-2022/executive-summary [23] IEA Report, 2021. The role of critical minerals on clean energy transitions. https://www.iea.org/reports/the-role-of-critical-minerals-in-clean-energy-transitions [24] IEA provides data based on capacity (per MW). But the capacity factor or availability of wind and solar power to generate electricity is lower than natural gas and coal power. Also, the life of solar and wind power is lower than natural gas and coal power. So, a solar or wind power plant with the same capacity as a fossil fuel power plant produces much lower electricity over the life. A more relevant approach is to compare the materials required per unit electricity produced by the power plants over the lifetime. I have converted the IEA data from materials required per capacity to materials required per unit electricity generated over the lifetime. I have used average data from IEA reports for the capacity factors and lifetimes. I have used the average of natural gas and coal power to represent fossil fuel power. https://www.iea.org/data-and-statistics/charts/average-annual-capacity-factors-by-technology-2018https://www.iea.org/reports/energy-technology-perspectives-2023 [25] USGS Lithium data. https://pubs.usgs.gov/periodicals/mcs2023/mcs2023-lithium.pdf [26] USGS Nickel data. https://pubs.usgs.gov/periodicals/mcs2023/mcs2023-nickel.pdf [27] USGS Cobalt data. https://pubs.usgs.gov/periodicals/mcs2023/mcs2023-cobalt.pdf [28] IEA Report. Energy Technology Perspectives 2023. Pages 86,87,90,96. https://www.iea.org/reports/energy-technology-perspectives-2023# [29] IEA Report. Energy Technology Perspectives 2023. Page 62. https://www.iea.org/reports/energy-technology-perspectives-2023# [30] IEA Report. Critical minerals review 2023. https://www.iea.org/reports/critical-minerals-market-review-2023 [31] Oakridge National Laboratory Report. Environmental quality and U.S. power sector. Air quality, water quality, land use and environmental justice. https://www.energy.gov/sites/prod/files/2017/01/f34/Environment%20Baseline%20Vol.%202--Environmental%20Quality%20and%20the%20U.S.%20Power%20Sector--Air%20Quality%2C%20Water%20Quality%2C%20Land%20Use%2C%20and%20Environmental%20Justice.pdf [32] U.S. EIA Data. International. Electricity. https://www.eia.gov/international/data/world/electricity/electricity-generation? [33] Sabin Center for Climate Law Report. Opposition to renewable energy facilities in United States. May 2023 edition. https://scholarship.law.columbia.edu/sabin_climate_change/200/ [34] IEA Report. Energy Technology Perspectives 2023. Pages 71–75. https://www.iea.org/reports/energy-technology-perspectives-2023# [35] IEA Report. Energy Technology Perspectives 2023. https://www.iea.org/reports/energy-technology-perspectives-2023# [36] IEA Report. Energy Technology Perspectives 2023. https://www.iea.org/reports/energy-technology-perspectives-2023# [37] McKinsey & company. Renewable energy development in a net-zero world. Overcoming talent gaps. https://www.mckinsey.com/industries/electric-power-and-natural-gas/our-insights/renewable-energy-development-in-a-net-zero-world-overcoming-talent-gaps [38] IEA Updated 2023 report: Net zero by 2050. https://www.iea.org/reports/net-zero-roadmap-a-global-pathway-to-keep-the-15-0c-goal-in-reach IEA Commentary. https://www.iea.org/commentaries/reaching-net-zero-emissions-demands-faster-innovation-but-weve-already-come-a-long-way [39] Also, many of the commercially available low carbon technologies are not yet competitive. The market uptake of these technologies has mostly been driven by massive subsidies. [40] IEA Report. Energy Technology Perspectives 2023. Page 50. https://www.iea.org/reports/energy-technology-perspectives-2023# [41] IEA Report, 2021. The role of critical minerals on clean energy transitions. https://www.iea.org/reports/the-role-of-critical-minerals-in-clean-energy-transitions [42] IEA Report. Energy Technology Perspectives 2023. Pages 86,87,90,96. https://www.iea.org/reports/energy-technology-perspectives-2023# [43] IEA Report. Energy Technology Perspectives 2023. Pages 86,87,90,96. https://www.iea.org/reports/energy-technology-perspectives-2023# [44] IEA report (2022). Accelerating sector transitions through stronger international collaborations. https://www.iea.org/reports/breakthrough-agenda-report-2022 [45] Global conflict tracker. https://www.cfr.org/global-conflict-tracker [46] Carnegie endowment for international peace. The China-US trade war has become a cold war. https://carnegieendowment.org/2021/09/16/u.s.-china-trade-war-has-become-cold-war-pub-85352 [47] United Nations. Covid vaccines. Widening inequality and millions vulnerable. https://news.un.org/en/story/2021/09/1100192 [48] Our World in data. Coronavirus vaccinations. https://ourworldindata.org/covid-vaccinations [49] One assumption is human ingenuity will somehow prevail. This is an irrational argument given the ground realities. Often, poor analogies such as success with COVID vaccine and space and technology programs are used. The analogies are irrelevant because these prior successes required a tiny fraction of physical resources that will be required for the low carbon energy transition. Myth: The concern related to critical minerals is being exaggerated w.r.t low-carbon transition.9/30/2022  Critical minerals are those that are required for important applications and are at risk for supply disruption [1]. Example applications are high technology devices, defense applications and energy technologies. Low-carbon technologies require a wide range of critical minerals. For example, batteries require cobalt, lithium, nickel, manganese, and graphite, whereas wind turbines and electric vehicles require rare earth elements [2].
Abundant access to critical minerals is crucial for the popular low-carbon energy technologies. Why? Because these technologies require several-fold larger amounts of critical minerals compared to conventional technologies [3]. Currently, adequate access to critical minerals is not an issue because the deployment levels of low-carbon technologies are very small. For example, wind and solar combined provide less than 5% of the total global energy and electric cars represent 1% of the total global car stock [4,5]. But a low-carbon energy transition will cause a drastic change. The deployment of solar, wind, battery energy storage and electric cars will need to increase enormously over the next few decades. An extraordinary increase in the production of critical minerals will be required to support such a deployment [3,6]. Mining and processing of minerals is extremely resource intensive. Examples of resources are energy, land, water, chemicals, and labor. History has shown that resource intensive processes when carried out at very large scales have serious unintended consequences. Also, resource intensive processes have high associated costs and can lead to supply concerns. Such concerns are expected to increase with an increasing demand for these materials. The key concerns about critical minerals are summarized below [2,3,6]: Concern about energy security: The production and processing of critical minerals is concentrated in fewer geographical locations than fossil fuels [7]. For example, just three countries control the global output for lithium, cobalt, and rare earth metals. Moreover, certain countries such as China have an alarmingly large share. Chinese companies have also made large investments in countries–such as Australia, Chile, Democratic Republic of Congo, and Indonesia–that have large capabilities for producing critical minerals. In other words, the few countries who currently control the supply of critical minerals could control the global energy supply. This is an energy security risk for the rest of the world. Concern about environmental impact: Examples of environmental impact related to the production and processing of critical minerals are soil erosion, soil contamination, biodiversity loss, contamination of water bodies by chemicals, reduced surface water storage capacity, hazardous waste, and air pollution from fine particles. A large increase in the production and processing of mineral resources could markedly increase the risk of severe environmental impacts. Concern about costs and supply: Several factors contribute to the cost and supply risk of minerals. Key factors are highlighted. A decrease in the quality of resources in the future is a significant concern. The extraction of metals from inferior quality ores requires more energy and creates more waste. Thus, deteriorating quality of resources impacts both cost and the environment. Mining projects typically require many years to move from discovery to production–which has significant supply related implications. Also, the massive and long-term need for critical minerals can cause periodic disruptions in energy supply, which can lead to large cost fluctuations. What about recycling? Will that easily solve the problem? Recycling involves the collecting and processing of materials that would otherwise be discarded as trash and turning them into new products. Recycling has several benefits such as reducing waste, conserving resources, and avoiding pollution. But recycling has some major challenges. Several requirements must be satisfied simultaneously for successful recycling. The requirements include a) an efficient process for collecting and separating materials at the end-of-life, b) a recycling process that can provide the desired material quality with low processing losses, and c) a stable long-term supply of the recycled material. It is very difficult to satisfy such requirements because of the logistical, technical, and cost challenges. The degree of the challenge depends on the type of material that is being recycled and nature of the application. The difficulty in achieving high recycle rates is evident from historical data. For reference, we will consider plastic waste and electronic and electrical waste (e-waste) recycling. According to recent OECD reports, less than 10% of global plastic waste is recycled [8,9]. For reference, the recycling rate for plastics in 2018 was only about 9% in the United States [10]. Recycling of e-waste has also been low. The world produces about 50 tons of e-waste annually. Although e-waste contains expensive materials, only 20% of the e-waste is formally recycled according to the United Nations Environment Programme [11]. What is the current state of recycling for the low-carbon technologies? In case of solar power, the solar panels require the largest amounts of raw materials. Historically, recycling of solar panels has been very small. For example, only about 10% of the solar panels in the U.S. are recycled [12]. In case of wind power, about 85% of the wind turbine blades can be supposedly recycled [13]. But current recycle rates are very low because of the challenges [14,15]. Moreover, recycling cannot satisfy the massive critical minerals needs of the low-carbon technologies. There are two reasons. First, the current recycling of critical minerals is far from adequate. For example, less than 1% of lithium is recycled [16]. Second, even if high rates of recycling were miraculously achieved for all critical minerals, only a small fraction of the critical minerals demand can be met by recycling. Why? Because addressing the goals of the Paris Agreement requires a rapid increase in low-carbon technologies and thereby rapid access to large amounts of critical minerals. Considering the challenges and the historical data from other technologies, the hope that recycling will be an easy solution is not realistic. Summary: The main concerns related to the critical minerals required for a low-carbon transition are energy security, environmental impact, supply risk and cost escalation. Any of these can cause serious problems. For example, a few countries control the production and processing of some of the critical minerals. This poses an energy security risk for the rest of the world. What about recycling? Several requirements must be satisfied simultaneously for successful recycling. The requirements include a) an efficient process for collecting and separating materials at the end-of-life, b) a recycling process that can provide the desired material quality with low processing losses, and c) a stable long-term supply of the recycled material. Examples from history–such as plastics and e-waste–inform that it is extremely difficult to satisfy such requirements because of logistical, technological, and cost challenges. References
 The levelized cost of electricity (LCOE) metric is commonly used to compare the electricity costs from these technologies. Such comparisons are widely used to argue that the electricity generated from solar and wind has lower cost than that from fossil fuels. As discussed below, this is scientifically incorrect.
Solar and wind technologies provide electricity on an intermittent basis, i.e., they lack the functionality to meet 24X7 electricity demand. On the other hand, fossil fuel and nuclear power plants provide 24X7 electricity. The U.S. Energy Information Administration lists solar and wind in a separate category because of this important distinction [1]. Solar and wind are listed as resource-constrained technologies, while nuclear and fossil fuel power plants are listed as dispatchable technologies. The intermittency challenge of solar and wind causes imbalance between electricity production and demand [2,3]. Electricity is only generated during certain hours of the day in case of solar and wind. But electricity demand exists around-the-clock, which causes an imbalance. The imbalance is addressed by lowering or increasing the output from the dispatchable power plants [4,5]. Essentially, the dispatchable power plants are forced to sacrifice their performance to accommodate solar and wind power. This forced inefficient use of the dispatchable power plants causes an overall sub-optimization of the electrical grid [6]. This increases the overall electricity cost [7]. The forced curtailing (i.e., restricting) of electricity production from solar or wind is another instance of sub-optimization [8]. For example, California was forced to curtail 1,500,000,000 kWh of electricity production from solar in 2020 because of the imbalance between production and demand [9]. How much is 1,500,000,000 kWh? The global average consumption of electricity per person in 2020 was about 3300 kWh [10]. Thus, in 2020, California was forced to curtail the amount of electricity that would have met the needs of over 400,000 individuals. The share of electricity generation from solar in California was only about 15% in 2020 [11]. Despite these low levels, California was forced to curtail about 5% of its utility-scale solar electricity production in 2020. These forced curtailments are expected to increase significantly with increasing solar deployment [12,13]. Sub-optimization of the electrical grid has a negative impact on the economics [14]. The extent of sub-optimization increases with increasing deployment of solar and wind power in the grid [15]. Consequently, wide-scale deployment of solar and wind is costly. The Organization for Economic Cooperation and Development (OECD) recently co-published a comprehensive report on this topic [16]. The report provides an example estimate for the cost penalty resulting from the sub-optimization caused by solar and wind. A 10% deployment of solar and wind was found to add a 5% cost penalty to the total electricity cost. Notably, a 50% deployment of solar and wind was found to penalize the total electricity cost by over 40%. The penalty results from the extra costs related to the deficiencies of solar and wind [17]. These additional costs arise from the variability of power output, uncertainty in power generation and increase in costs for transmission and distribution associated with solar and wind power [18]. The costs that are routinely reported in media do not include the cost penalties. Thus, the reported costs do not reflect the true costs for solar and wind power. Only partial costs of solar and wind power are widely reported in media. Consequently, the reported costs cannot be directly compared with dispatchable technologies. Media is flooded with articles advertising that solar and wind power is cost competitive with fossil fuel power. Such cost comparisons are misleading unless the shortcomings and related implications are also highlighted. Unfortunately, valid cost comparisons are not discussed in media. By excluding crucial information, these media reports provide an incorrect perception about the true cost of a low-carbon transition. Summary: Solar and wind cannot generate 24X7 electricity on a standalone basis. Therefore, their costs cannot be directly compared with technologies that can generate 24X7 electricity. The effect of intermittency must be included in a realistic cost comparison. When the intermittency deficiency is included in the cost estimate, the costs for solar and wind power increase significantly. The cost increase is directly proportional to the extent of deployment. Higher solar and wind power in the electrical grid equals higher cost penalty. Unfortunately, most publications focus only on the partial costs of solar and wind power, i.e., they exclude costs related to the intermittency deficiency of solar and wind power [19]. References
 Over the decades, media and certain scientists have greatly exaggerated the speed and magnitude of the impact from climate change. Essentially, they have been catastrophizing. For example, the renowned physicist John Holdren proposed in the 1980s that human-caused climate change could kill a billion people because of famine by the year 2020 [1]. Such proposals have no credibility because they are purely speculative, i.e., they are not based on robust science [2]. The global scientific community does NOT support such proposals.
The global scientific community does support the general conclusions from the climate science community [3]. Why? Because the findings of the climate experts are based on extensive research. Thousands of climate scientists have gathered vast amounts of climate data using a suite of climate monitoring tools [4,5,6]. The scientists have used the climate data and established scientific principles to understand the climate system. These studies have been documented in over a hundred thousand scientific papers [7]. Many climate impacts are now understood with high to very high confidence because of these studies [8]. For example, there is strong evidence for the rising temperatures and sea levels, receding glaciers, ocean acidification, and the increasing frequency and intensity of hot extremes. Consequently, an overwhelming majority of climate scientists agree that human-caused climate change is a serious problem [9,10,11]. Significant uncertainty yet exists in understanding several other issues about climate change because of inadequate data [8]. However, the climate impacts that are understood with high confidence are by themselves adequate to demonstrate that human-caused climate change is a serious problem. Wild exaggerations by media or certain scientists do not change the validity of these conclusions. We will consider an analogy. The medical community has concluded that smoking tobacco is dangerous to human health based on extensive research [12,13]. Wild exaggerations by a few doctors–made in the past, present, or future–do not decrease the trustworthiness of the conclusion. Summary: Wild speculations by certain scientists and media should not be used as an excuse to ignore critical findings from the global climate experts. The findings of the climate experts are based on extensive research. Consequently, major scientific organizations agree that human-caused climate change is a serious problem that requires urgent attention [14]. Wild exaggerations by media or certain scientists do not change the validity of these conclusion. References & Notes
Subsidies are financial incentives from the government. According to the United Nations Development Programme (UNDP), fossil fuels receive about 425 billion dollars per year in global subsidies [1,2]. What is the source of the several trillion-dollar subsidies claim? IMF Reports According to a series of reports from the International Monetary Fund (IMF), the costs associated with external impacts from fossil fuels should also be included as subsidies [3,4]. Consequently, health and other costs related to air pollution and climate impacts are also included as subsidies in the reports. The IMF reports estimate the cost from the external impacts to be several trillion dollars per year. For example, the recent 2021 IMF report claimed that the global subsidies for fossil fuels were 5.9 trillion dollars in 2020 [3]. The 2021 report is considered as the reference IMF report for this article. The claim in the report has significant credibility problems as discussed below [5]. Historically, the costs from external impacts such as pollution have been addressed via control policies/technologies. The cost-efficiency for such control technologies is very high. For example, U.S. EPA estimates that the cost of air pollution control technology is 30 times lower than the costs arising from air pollution [6]. Thus, a 35-billion-dollar investment in air pollution control technology can eliminate a trillion-dollar cost. In other words, the external cost figures in the report are highly exaggerated. The report includes road congestion, road accidents and road damage as an external impact from fossil fuels [7,8]. That is like saying the agriculture industry is responsible for the growing obesity in the global population. To make matters worse from a credibility viewpoint, road congestion, traffic accidents and road damage represent the costliest impact from gasoline in the IMF report. So, based on the report, the largest component of the gasoline subsidy is related to its contribution to road congestion, traffic accidents and road damage. Clearly, the costs discussed in the IMF reports are exaggerated and misleading. Most media reports do not discuss these critical facts. They only advertise that fossil fuels receive several trillion dollars of subsidies [9]. This misinformation has been soaked up by the general population and is causing confusion about the societal costs related to the low-carbon energy transition. References & Notes
|
Tushar ChoudharyAuthor, Scientist, Innovator Archives
February 2024
Categories |
 RSS Feed