|
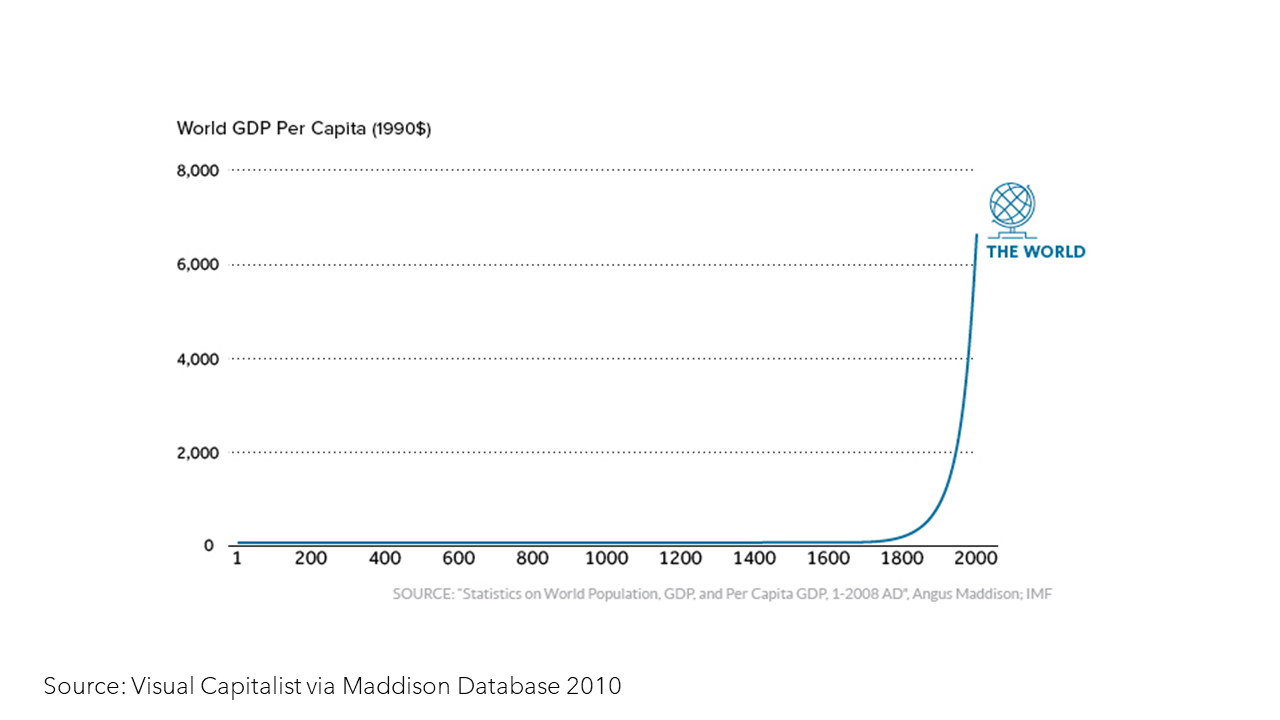
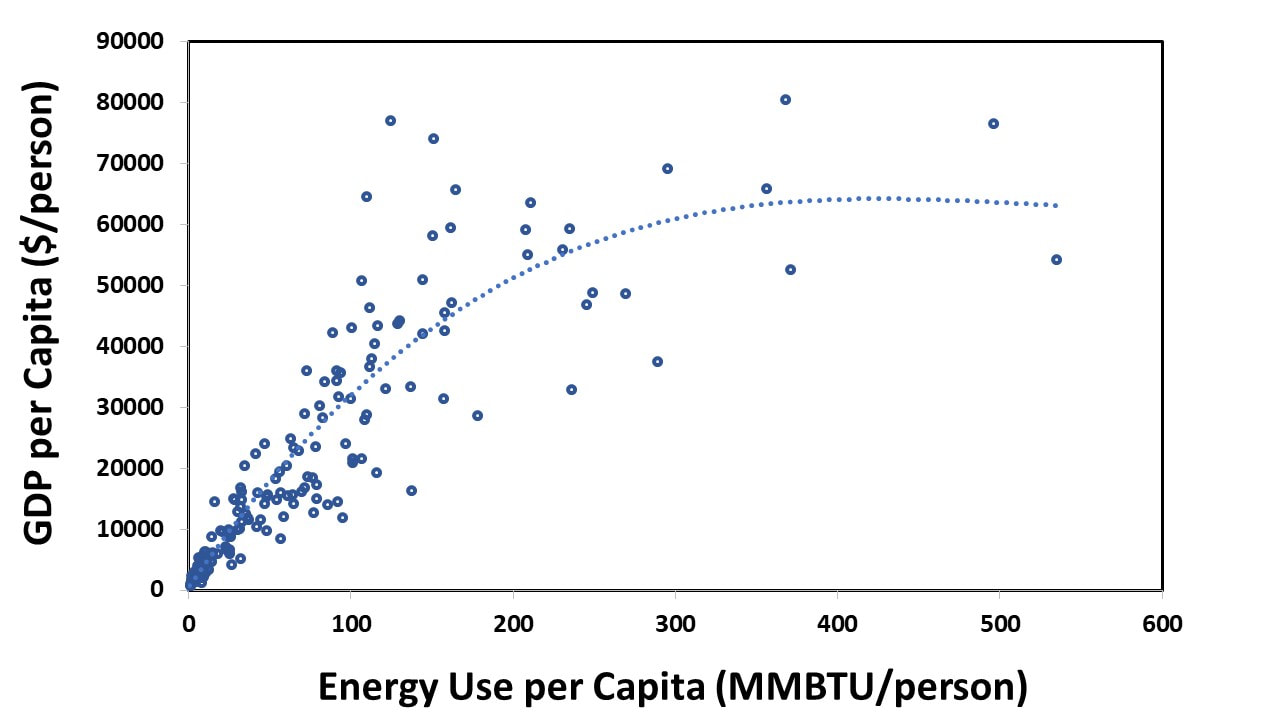
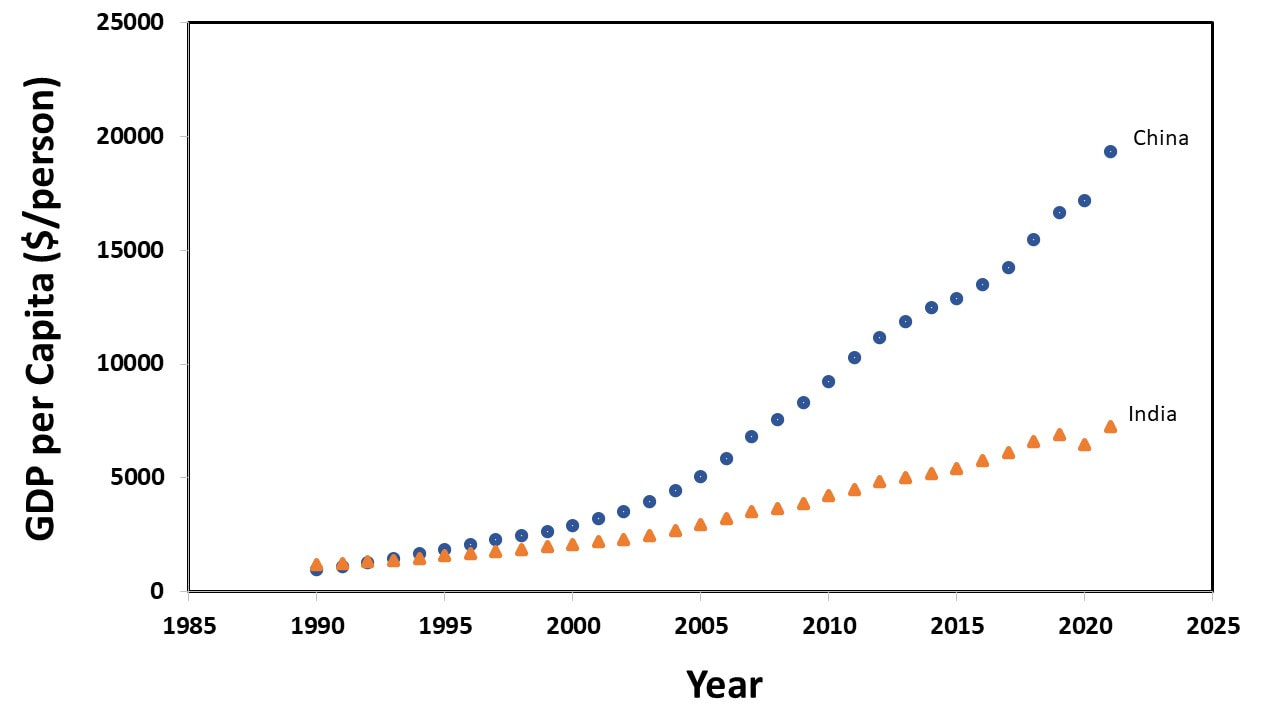
A shift to a low carbon energy system is key to mitigating climate change. Countries across the globe are in the early stages of transforming their energy systems. In this context, it is important to understand the impact of the level of energy use on the standard of living of the global citizens. The standard of living in a country can be numerically discussed in terms of its gross domestic product (GDP) per capita. GDP is the value of goods and services produced in the country. It is commonly used to discuss the economic state of a country. GDP per capita of a country is the GDP of the country divided by its population. Developing countries have a much lower GDP per capita (standard of living) compared to developed countries. Evolution of the standard of living of global citizens over timeIt is helpful to first discuss how the global average standard of living or world GDP/capita has evolved over the past two thousand years. As we can see from the figure, the GDP per capita was almost flat until the last couple of centuries (Figure 1)¹. But after that there was an exponential increase in the GDP per capita. Energy played a major role in this. Figure 1. Global GDP per capita over time. Source: Visual Capitalist via Maddison project 2010 For most of human history the primary source of energy was biomass such as wood, waste crop and animal manure. Humans used biomass for heating and cooking. For most other purposes the global society used either human labor or animal labor. Such inefficient use of energy kept the society very busy just meeting basic needs. This limited the progress of the human society. But everything changed after humans learnt how to efficiently harness energy from fossil fuels. Fossil energy was used to fuel machines which could do the work of many men and animals. This mechanization of operations was crucial. Because of this, a much smaller fraction of the population was needed to meet the basic needs of the society. Many now had time for other pursuits, such as making medical and technology advances. There was a further increase in productivity with ongoing technology innovation. The global energy use increased rapidly to support the rise in productivity. This resulted in the exponential increase in global productivity and thereby the standard of living of the global average. The global average data, however, does not provide the complete picture. The progress of the society has not been equal in all countries. Some countries have progressed far more than others. This is because the energy use per capita increased at widely different rates across the globe. For example, the rate of increase was markedly higher in European countries and the United States. However, the rate of increase was much slower in many countries in Africa, Asia, and South America. Recent data for more than 170 CountriesThe rate of the increase in the use of energy per capita has varied widely across the globe over the past two centuries. So, currently there is a very wide variation in the energy use per capita amongst the different countries. The wide variation is energy per capita has resulted in a wide variation in the standard of living (GDP/capita). The relation between GDP per capita, and energy use per capita of over 170 countries across the globe for the year 2021 is shown in Figure 2²𝄒³. The relation is interesting. Figure 2. Data from more than 170 countries showing the relation between their standard of living (GDP per capita) and energy use per capita. Data is for the year 2021. Data Source⁴𝄒⁵ The World Bank and U.S. EIA A strong linear correlation is observed until a certain level of energy use per capita is achieved by a country. I will refer to this level as the poverty-buster level. The data shows the poverty-buster level is 80 million BTU of energy use per person. For reference, 1 million BTU = 293 kWh. High-income countries or advanced economies use far more than this level of energy. The figure shows that the GDP per capita correlates very strongly with energy per capita for low- and mid-income countries. The human development index also correlates strongly with energy per capita in case of low- and mid-income countries⁶𝄒⁷. This index includes key dimensions of human development such as a long and healthy life, good education, and a decent standard of living. Developed countries have a high GDP per capita because of their high energy use. But many developed countries use far more energy than the poverty-buster level of 80 million BTU per person. The GDP per capita is less sensitive to the energy per capita beyond the poverty-buster level. But a major fraction of the global population lives in countries where the energy use is below the poverty-buster level of 80 million BTU per person. For example, the energy per capita in India is less than 25 million BTU per person⁸. So, its energy use per capita is far below the poverty-buster level. Even a moderate increase in the energy use in such countries will lead to a substantial increase in their GDP per capita. This means a much better standard of living and human development index. Case Study: Comparison of China with IndiaThe case of China and India is useful to discuss the importance of increasing the energy use in developing countries. Both India and China had a similar GDP per capita in 1990⁹. China increased its energy use per capita almost twice as fast as India since 1990. Figure 3 shows the massive benefit to China’s GDP per capita because of the faster increase in its energy use. Figure 3. Comparison of GDP per capita between India and China since the year 1990. Data Source¹⁰: The World Bank. Implications
The data discussed in the earlier section has critical implications. Most developing countries will need to markedly increase their energy use to achieve a decent standard of living for their citizens. More than half of the global population currently lives on less than $10 per day¹¹. Most of this population lives in developing countries. Adequate access to low-cost energy is crucial to the progress of developing countries. The situation is different for developed countries. They already have an excellent standard of living because of high energy use. These countries have an energy per capita that is far more than the poverty-buster level. The standard of living in such countries will not improve much by a further increase in energy use. Countries with a very high energy per capita can decrease their energy use substantially without a major compromise to their standard of living or human development index. Note: This is a modified excerpt from my book “The Climate Misinformation Crisis: How to move past the mistruths to a smarter energy future. References & Notes[1] Visual Capitalist via Maddison database 2010. https://www.visualcapitalist.com/2000-years-economic-history-one-chart/ Maddison Database 2010. https://www.rug.nl/ggdc/historicaldevelopment/maddison/releases/maddison-database-2010?lang=en. [2] U.S. EIA. International Data. Energy Intensity. https://www.eia.gov/international/data/world/other-statistics/energy-intensity-by-gdp-and-population? [3] World Bank data. GDP per capita, PPP (current international $). https://data.worldbank.org/indicator/NY.GDP.PCAP.PP.CD Use of GDP data in terms of PPP accounts for the difference in purchasing power of the different countries. [4] World Bank data. GDP per capita, PPP (current international $). https://data.worldbank.org/indicator/NY.GDP.PCAP.PP.CD [5] U.S. EIA. International Data. Energy Intensity. https://www.eia.gov/international/data/world/other-statistics/energy-intensity-by-gdp-and-population? [6] UNDP. Human development reports. https://hdr.undp.org/content/energising-human-development [7] Our World in data. Human development index vs GDP per capita, 2021. https://ourworldindata.org/grapher/human-development-index-vs-gdp-per-capita [8] U.S. EIA. International Data. Energy Intensity. https://www.eia.gov/international/data/world/other-statistics/energy-intensity-by-gdp-and-population? [9] World Bank data. GDP per capita, PPP (current international $). https://data.worldbank.org/indicator/NY.GDP.PCAP.PP.CD [10] World Bank data. GDP per capita, PPP (current international $). https://data.worldbank.org/indicator/NY.GDP.PCAP.PP.CD [11] World Bank data. https://pip.worldbank.org/home Data is in terms of 2017 PPP$. It accounts for the difference in the cost of living across countries. I input $10 for the poverty line to get the data.
0 Comments
Leave a Reply. |
Tushar ChoudharyAuthor, Scientist, Innovator Archives
February 2024
Categories |


 RSS Feed